

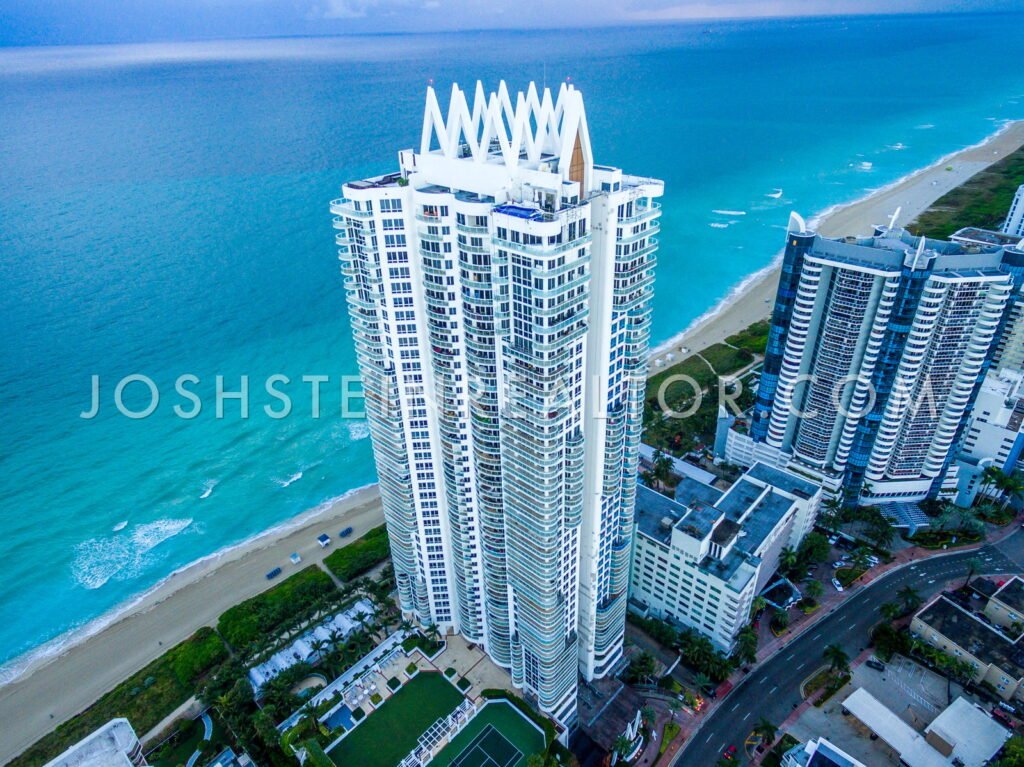
Neighborhoods · Miami Beach
By Josh Stein · Florida license SL3057661 · Updated 10 October 2026Leer en español →
- Asking range$95,000 to $80,000,000
- List price per sq ft$1,150
- Months of inventory12.4
- Sold, 12 months1603


Listing information is deemed reliable but is not guaranteed and is provided exclusively for consumers' personal, non-commercial use. Data is supplied by the MLS and may be subject to change or withdrawal without notice.
Last updated 42 minutes ago
Recently sold in Miami Beach
4 listings


Developer rendering of 42 Pine in Miami Beach at dusk
Aman Miami Beach from the beach at sunset — developer rendering
Aman Miami Beach beside the restored Versailles on the oceanfront — developer rendering
A primary bathroom at Five Park Miami Beach — developer rendering
A residence balcony at Five Park Miami Beach — developer rendering
Every building we track in Miami Beach Condos
33 condominiums we track in Miami Beach Condos, from the county roll. 24 of them have a building page.
What Miami Beach actually costs
Asking prices are opinions. This is what buyers actually paid — every qualified, arm’s-length sale on the county record, in the Miami Beach buildings we track.
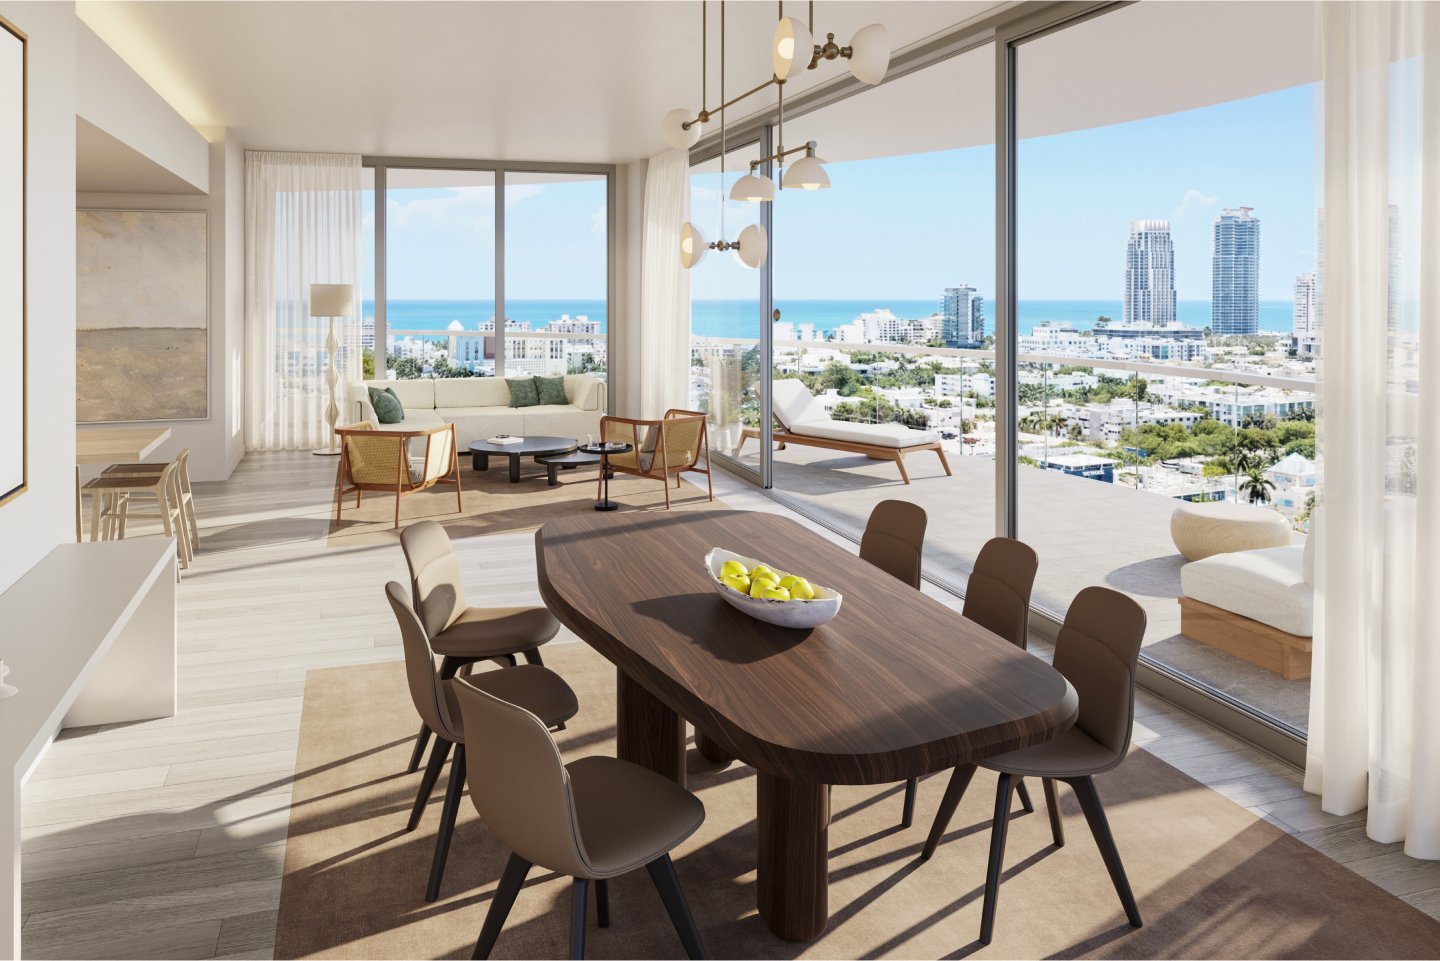
Five Park delivered in 2024 with just 98 residences across 48 stories; Five Park Miami Beach's post-delivery guide covers what resales cost today.
7709 Atlantic Way sold for $25.4 million in May 2021, the highest closed sale profiled in Altos del Mar's oceanfront home sales.
2026 to date−25.7%vs 2025 peak
4,067 homes across 30 condominium declarations on the county record. Median of qualified, arm’s-length sales, straight from the roll — not a portal’s estimate, and not the whole neighbourhood: these are the buildings we track.
Did owners make money · 2,655 resales on the record
Aerial view of Akoya in Miami Beach
Aerial view of Belle Isle in Miami Beach
Aerial view of Fontainebleau in Miami Beach
Aerial view of Fontainebleau in Miami Beach
Aerial view of Homes in Miami Beach
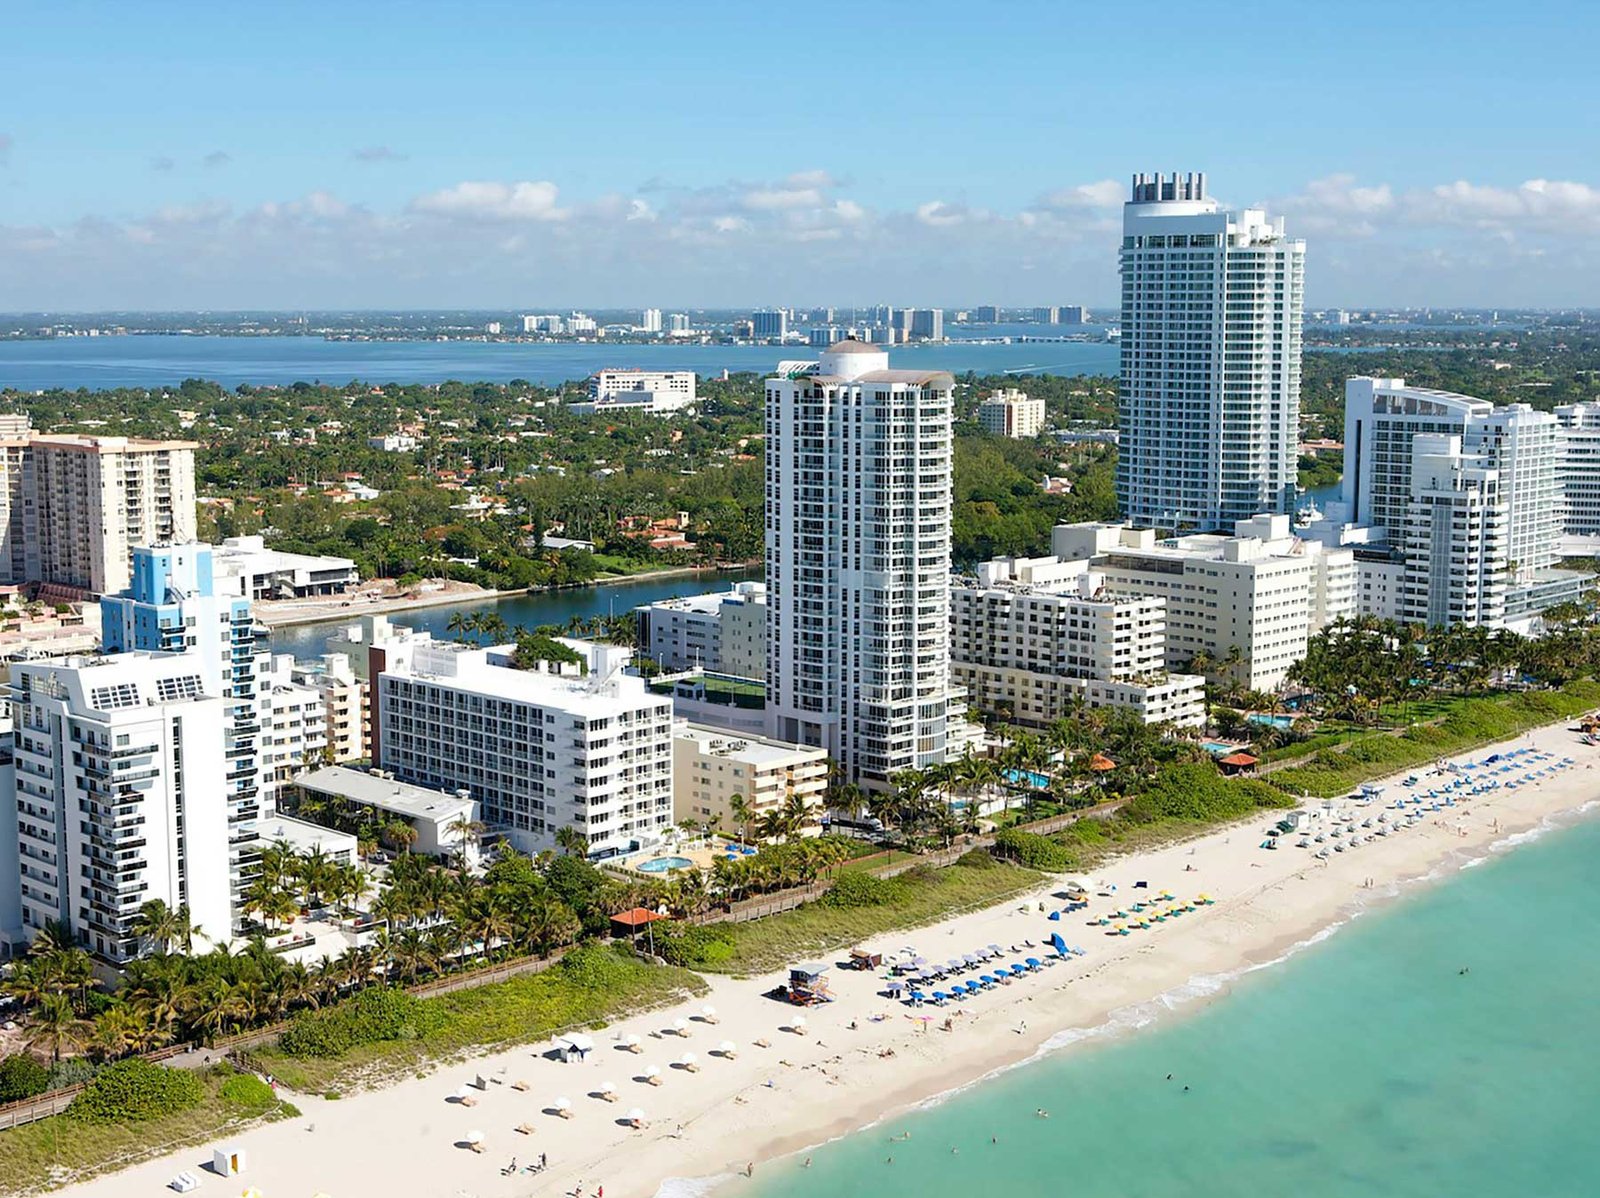
Aerial view of Miami Beach
Aerial view of Miami Beach
Aerial view of Miami Beach
Aerial view of Palm Hibiscus Islands in Miami Beach
Aerial view of Palm Hibiscus Islands in Miami Beach
Aerial view of Palm Hibiscus Islands in Miami Beach
What the 2026 numbers actually say. Every sale Miami-Dade County has recorded in 22 declarations and 3,165 homes — what buyers paid, not what sellers ask.
The county record
What Miami Beach actually costs
22 condominium declarations. 3,165 homes. Every sale Miami-Dade County has recorded in them.
Everyone else shows you what sellers are asking. This shows you what buyers paid.
2026 to date -3.7% vs 2025 peak
Did owners make money?
2,178 Miami Beach homes have been bought and sold again on the arm’s-length record. This is how they did.
Gross figures — the difference between two recorded prices, before commissions, taxes, assessments and carrying costs. Foreclosures and deeds in lieu are excluded: both legs must be qualified arm’s-length sales.
Every building, by price per square foot
Ranked on 2026 sales. Tap any building for its full record — the four-year table, the resale outcomes, and what the county holds.
Method. Every condominium declaration in Miami Beach retrieved folio by folio from the Miami-Dade County Property Appraiser and filtered to residential homes, excluding commercial, parking, cabana and storage. Each declaration is checked against its common-element shares, which by law sum to 100%, to confirm no part of a building is missing. Bulk and portfolio transfers are excluded outright. These are closed sales, not active listings, and 2026 is an incomplete year.
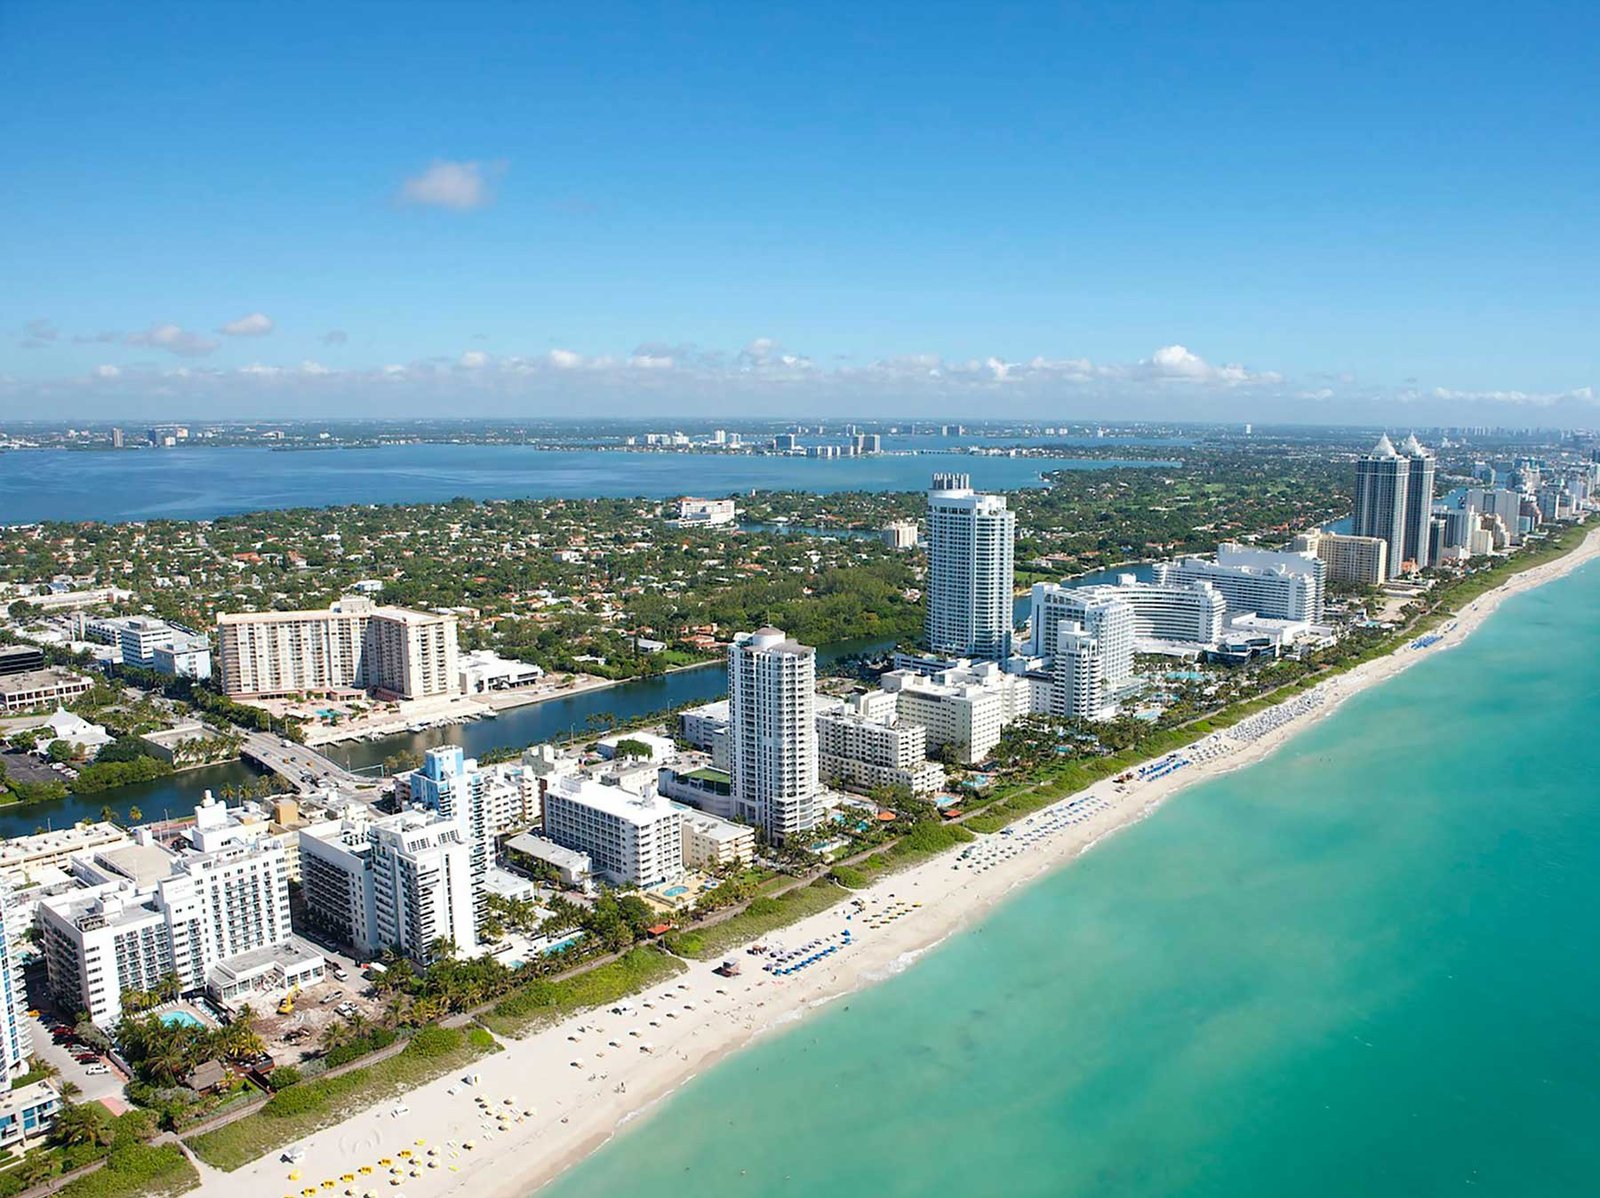
- Miami Beach is repricing, and the repricing is what makes it buyable. Luxury condo sales across the barrier islands rose 5% year over year in Q1 2026 — 231 sales against 220 — while price per square foot fell 14.8%, from $1,382 to $1,178. Buyers are transacting. Sellers are conceding.
- Inventory is shrinking, not building. Months of supply fell from 23 to 19 year over year, down 17%. That is a market clearing, not a market seizing — an important distinction from Edgewater, where the pipeline is still growing.
- Half the condo buildings are weak, and that is the whole game. One Q1 2026 classification of the Miami condo market put roughly 20% of buildings strong, 30% stable and 50% weak. The neighbourhood average is close to useless here. Building selection is everything.
- The broad market is soft. The Zillow Home Value Index for Miami Beach stood at $523,889, down 3.1% over the year to 31 May 2026, with median days to pending at 112.
- The very top is going the other way. Fisher Island price per square foot rose 19% year over year, $2,004 to $2,391. Scarcity beats sentiment.
–14.8% price per sq ft | +5% sales volume | 19 months of supply | 112 days to pending |
What the 2026 numbers actually say
Miami Beach headlines read badly at the moment, and the headlines are wrong about what they mean.
Take the two facts together. In Q1 2026, luxury condo sales volume rose 5% across the barrier islands — South Beach, Mid-Beach, North Beach, Surfside, Bal Harbour, Sunny Isles and Fisher Island — while price per square foot fell 14.8%, from $1,382 to $1,178. Days on market lengthened from 83 to 99.
A market where prices fall and volume also falls is a market with a demand problem. A market where prices fall and volume rises is a market where sellers have finally met buyers. That second thing is what is happening on Miami Beach.
The inventory figure confirms it: 19 months of supply, down from 23. Inventory is being absorbed, not accumulated.
Zillow's broader index tells the same story more bluntly — $523,889, down 3.1% year over year to 31 May 2026, with a median list price of $553,333 sitting below the $570,333 median sale price recorded a month earlier. Sellers have already cut. The asking prices you see now are mostly post-adjustment.
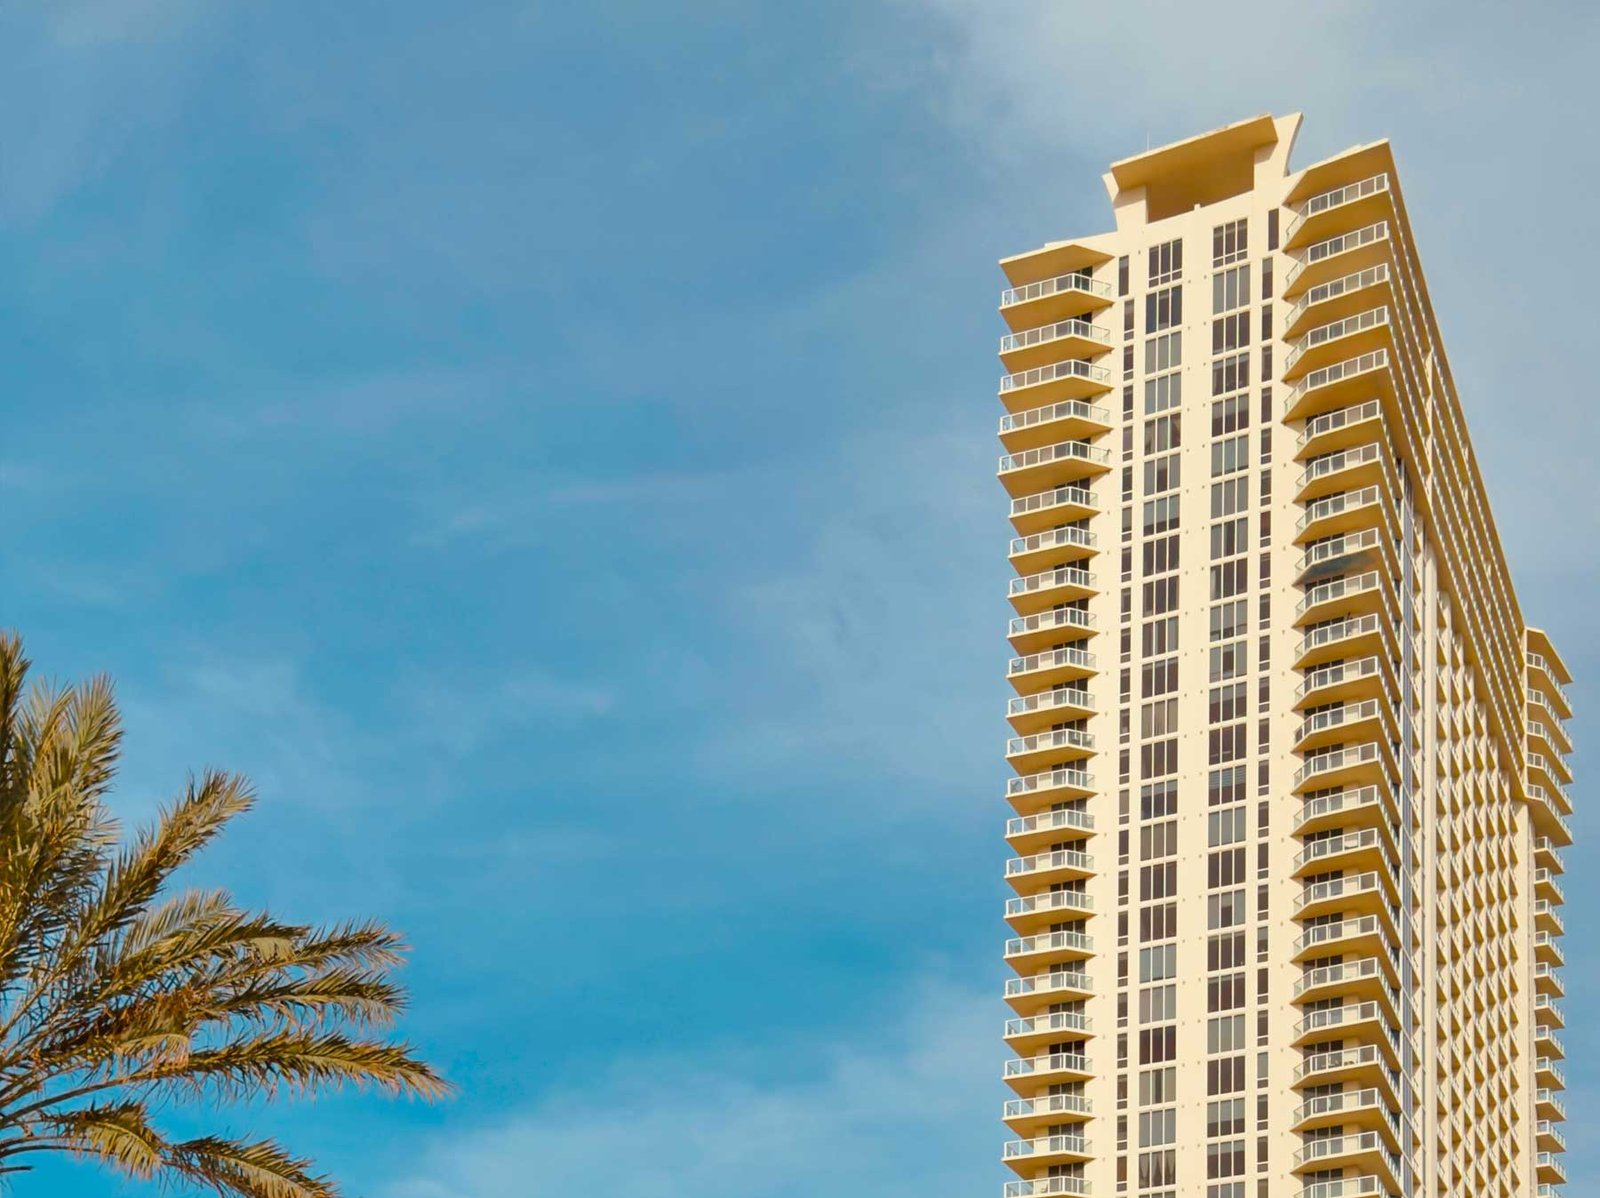
The 20/30/50 problem
This is the single most useful thing to understand before you buy a condo here, and almost nobody states it plainly.
A Q1 2026 classification of the Miami condominium market sorted buildings into roughly 20% strong, 30% stable and 50% weak. Half the stock is impaired — by structural obligations, reserve shortfalls, insurance costs, assessment history, or financing eligibility.
That distribution destroys the usefulness of any neighbourhood-level average. A 14.8% decline in price per square foot is not a 14.8% haircut evenly spread. It is a small number of well-run buildings holding value while a large number of impaired ones reprice hard.
Which means the question is never "is Miami Beach a good buy?" The question is always "is this building a good buy?" — and the answer varies more within a single block here than it does between neighbourhoods.
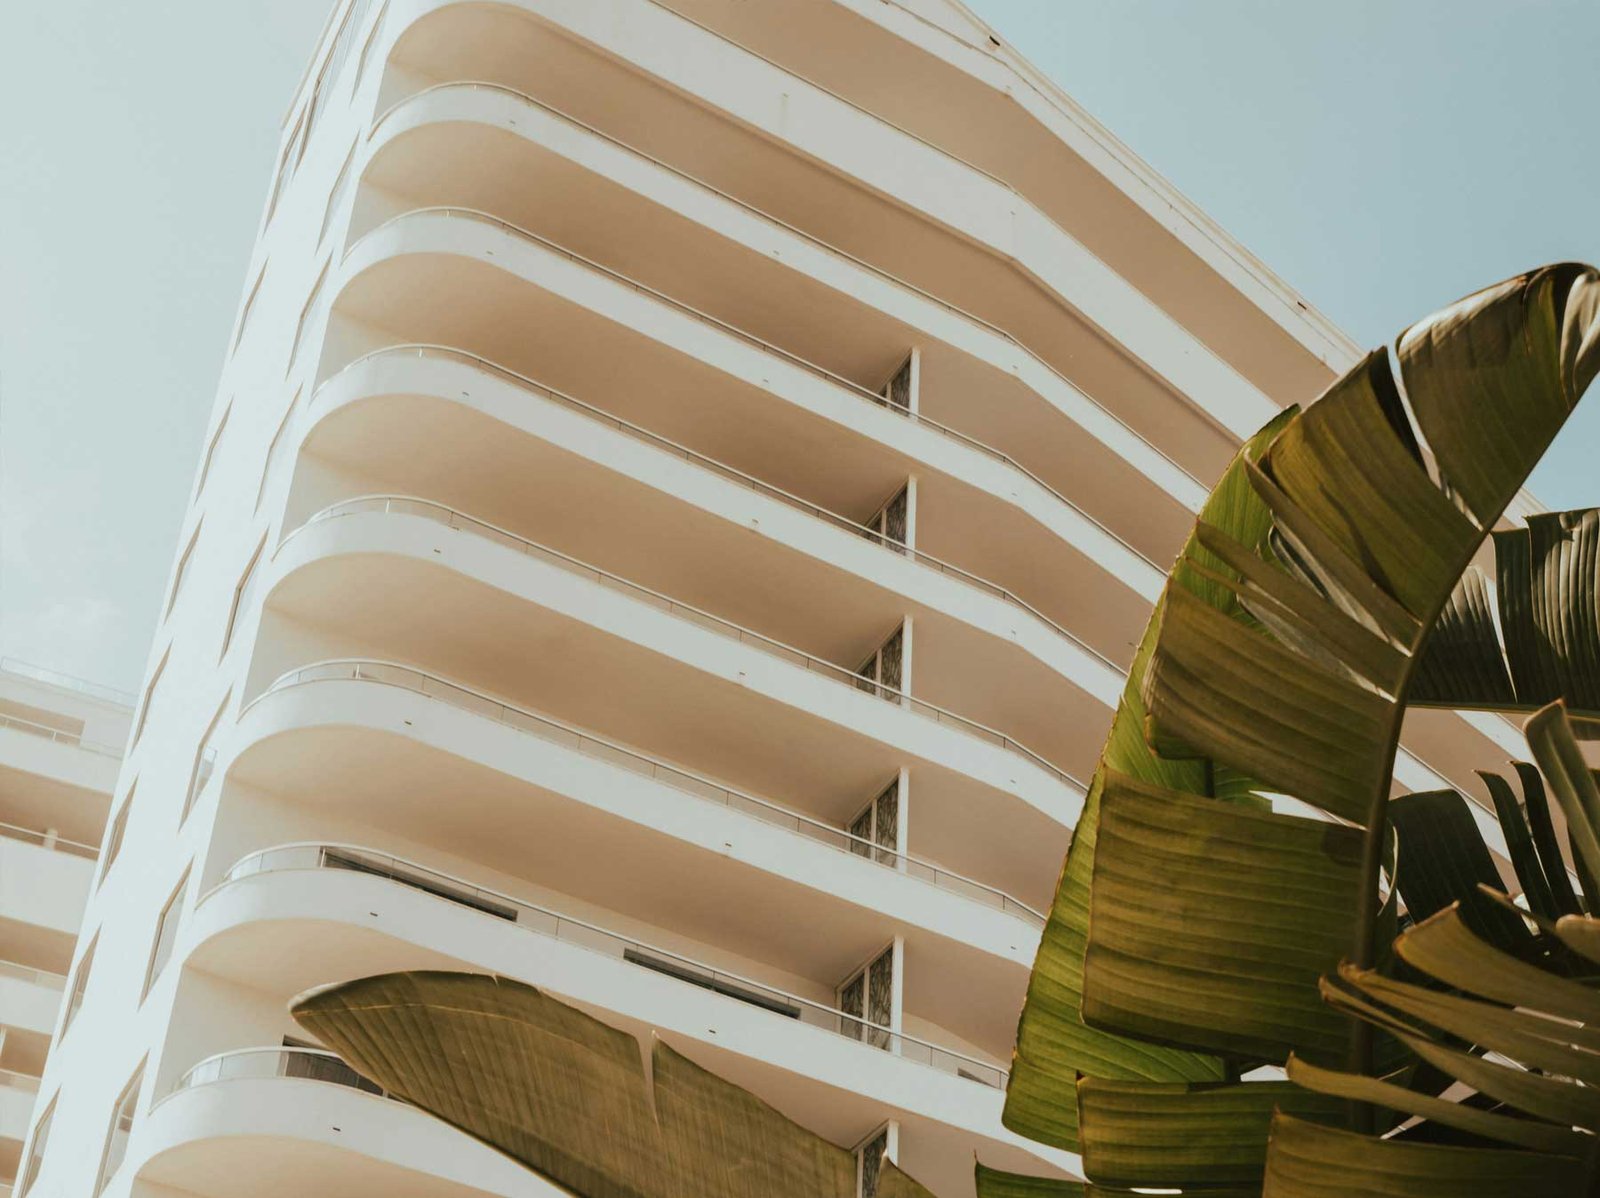
How to tell a strong building from a weak one
Five checks, in this order. They take a competent agent a couple of days and they are the difference between the 20% and the 50%.
- Is it warrantable? Fannie Mae and Freddie Mac maintain a non-public list of condominium projects they will not lend against, and the South Florida count has roughly doubled in two years. Limited Review — the shortcut that let a lender approve a unit without fully assessing the building — was eliminated on 3 August 2026, so more buildings now face full scrutiny. Units in ineligible buildings routinely trade 15% to 30% below comparable units in eligible ones. Full explanation on the Miami condos for sale page.
- Milestone inspection — the report, not the summary. Buildings three stories and above face structural milestone inspection at 30 years, sooner near the coast. Much of Miami Beach's stock is well past that.
- Is the association actually funding reserves? Associations that had waived reserves were required to begin funding them from 1 January 2026. A board still holding contributions artificially low is moving a cost onto your resale price.
- Assessment history and what is voted but not yet levied. Ask for two years of board minutes. This is where the real number hides.
- Insurance, quoted on the specific unit. Barrier island, older structure, ocean exposure. Get a real windstorm and flood number before you are emotionally committed.
A building that clears all five in a soft market is one of the better buys available in Miami right now. A building that fails two of them is cheap for a reason, and will still be cheap when you sell it.
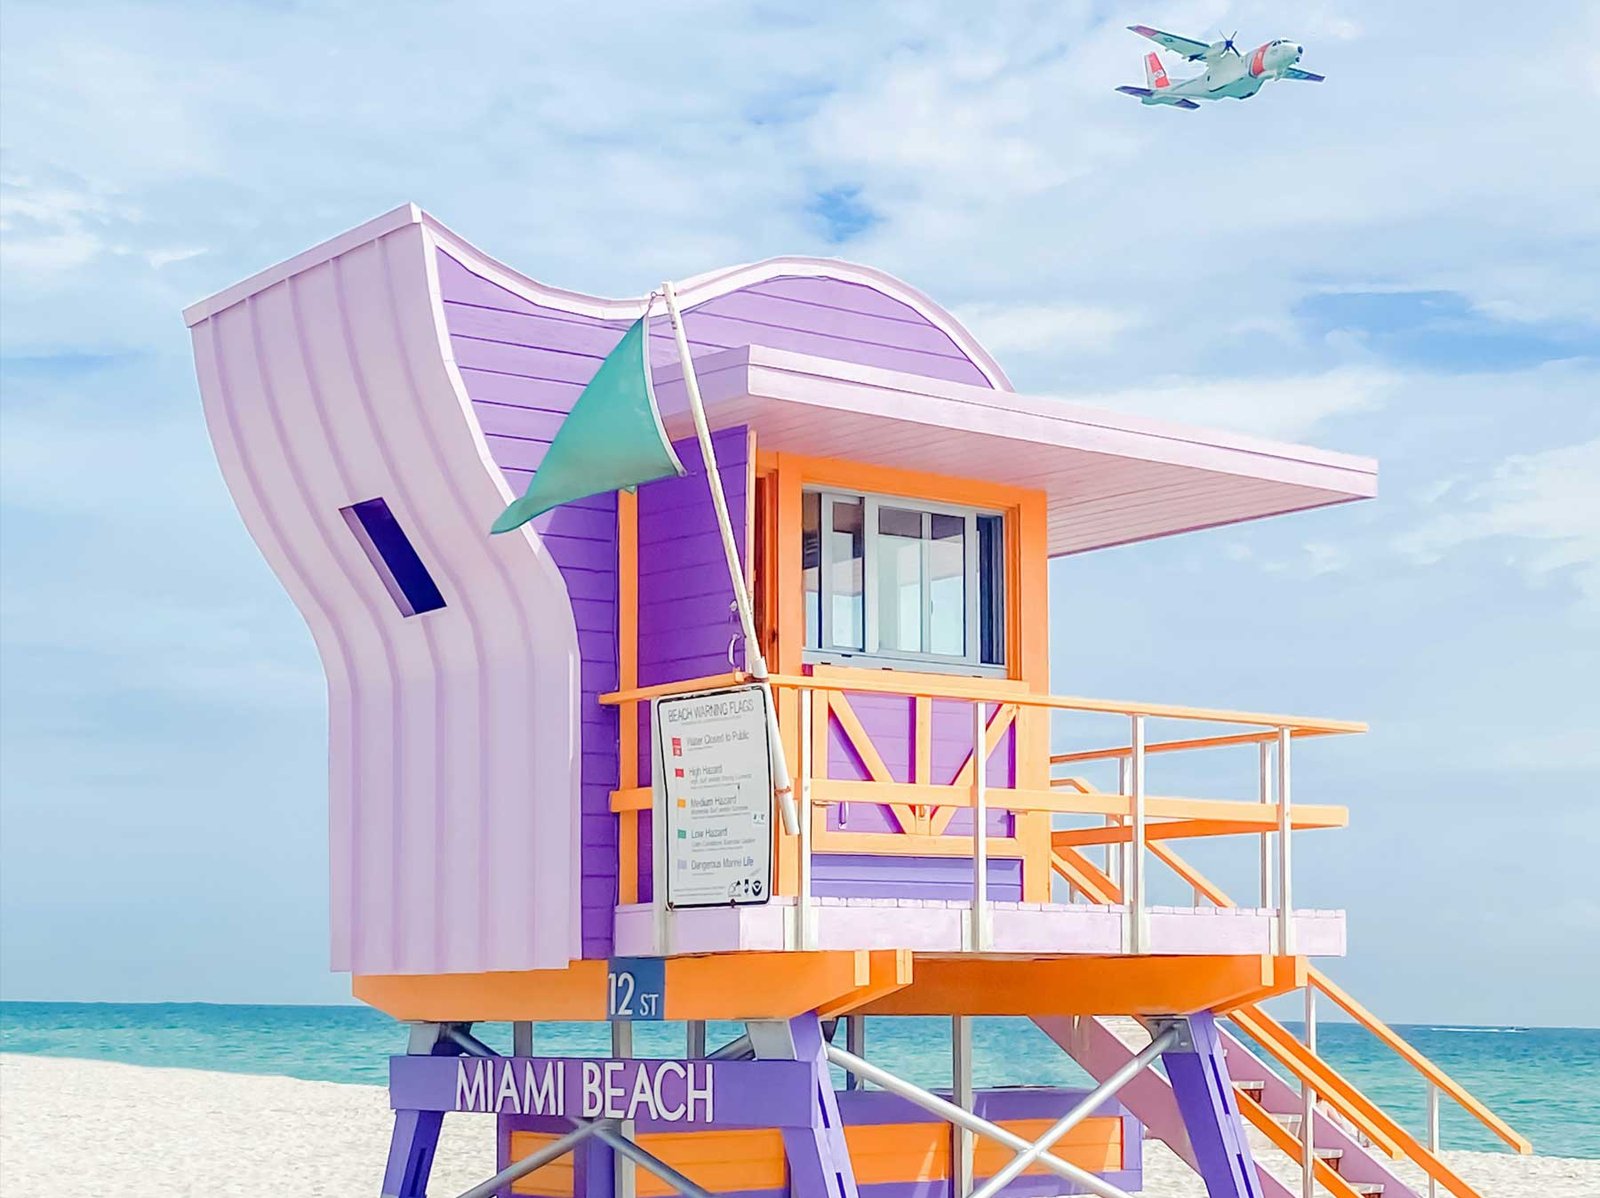
Miami Beach is several markets, not one
The city runs roughly seven miles north to south, and the sub-markets behave differently enough that a single median is close to meaningless.
- South Beach — the Art Deco district, the walkability, the tourist economy. Widest range of stock and the most variance in building quality. Start with the Art Deco guide if the pre-war buildings are what draw you.
- Mid-Beach — the Faena district and the newer oceanfront towers. Quieter than South Beach, and where a lot of the strong-building inventory sits.
- North Beach — the least expensive part of the island proper, and the one with the most 1950s and 1960s stock still to work through its structural obligations.
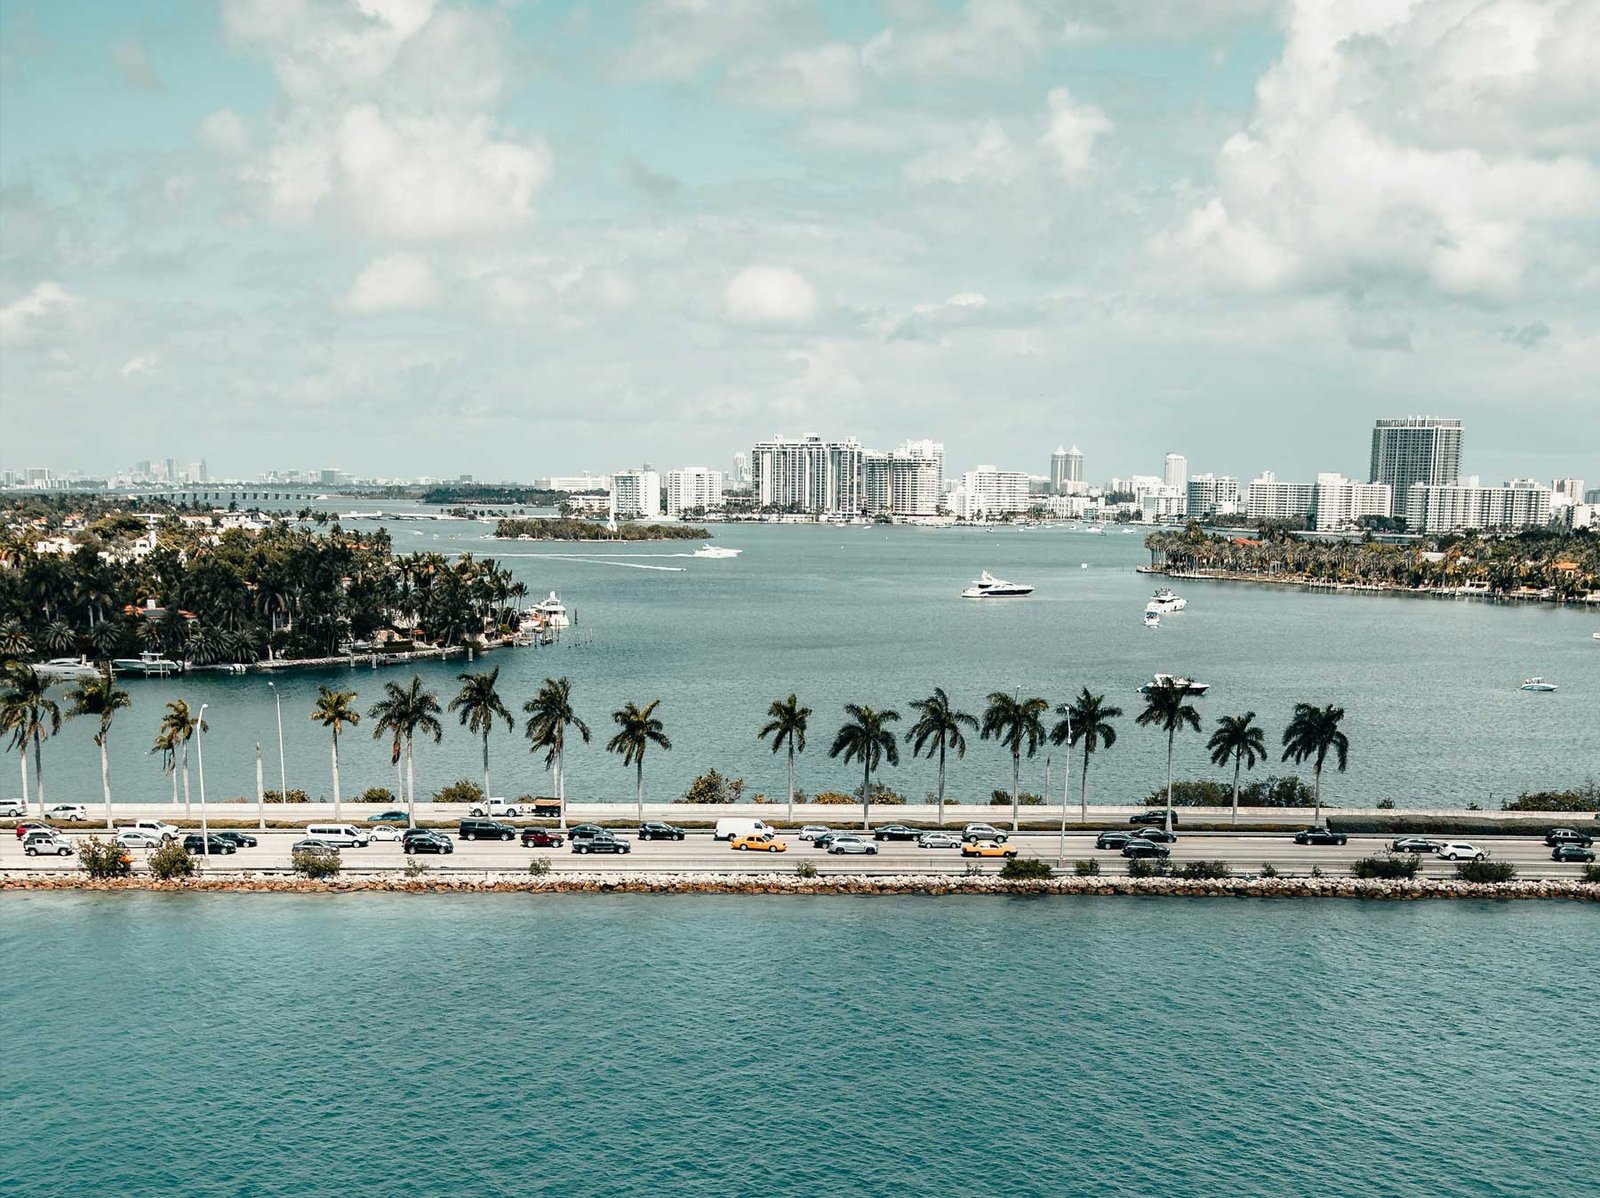
- Venetian Islands and Sunset Islands — bayfront single-family enclaves with dockage, minutes from both the beach and downtown.
- Star Island, La Gorce Island and North Bay Road — the trophy addresses. These trade on scarcity and are largely disconnected from the wider market's direction.
Immediately north, Surfside, Bal Harbour and Sunny Isles Beach are separate municipalities with their own rules and their own price structures, even though they sit in the same statistical bucket.
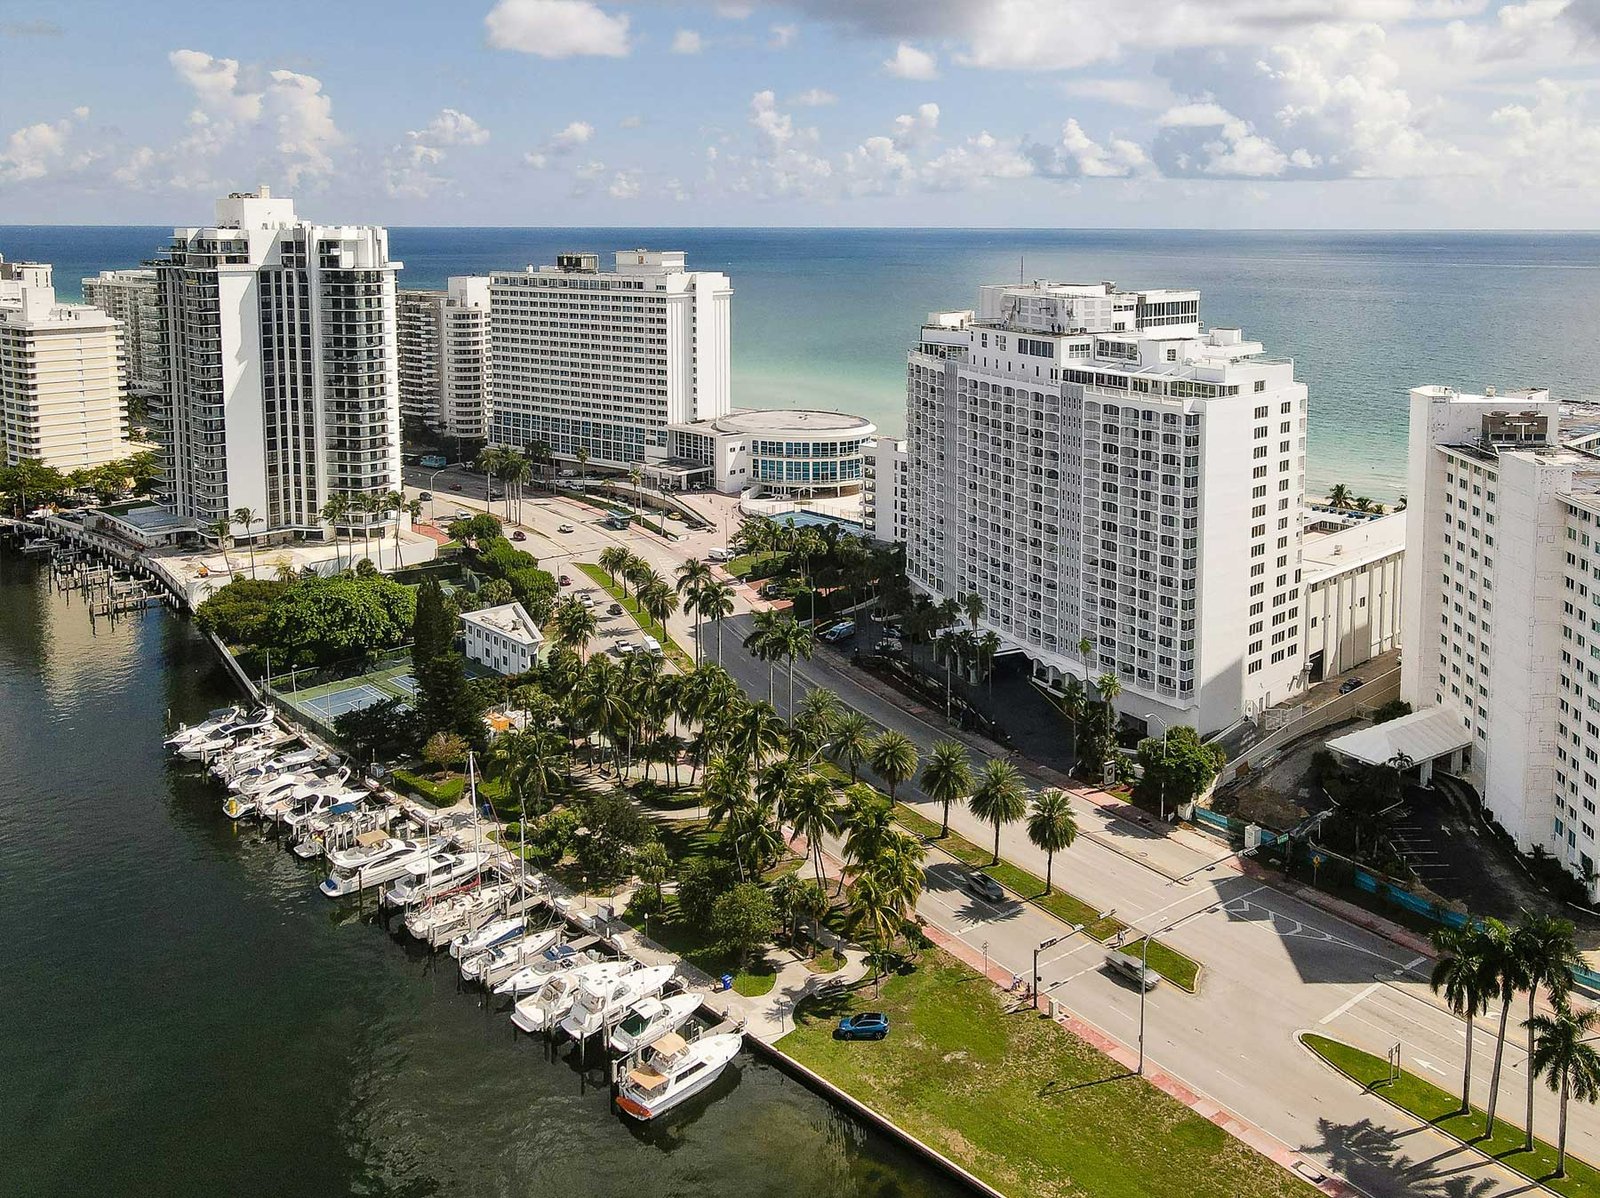
Every building in Miami Beach
Miami Beach is not one market, and buying it as though it were is the most expensive mistake I see. South of Fifth and North Beach are seven miles and roughly a thousand dollars a foot apart. Below is every Miami Beach building with a page on this site, grouped by where it actually sits — because on this island the block is the asset.
Twelve blocks at the southern tip, with the highest price per square foot in Miami Beach and almost no new supply coming.
- Apogee South Beach
S. Pointe Drive - Continuum South Beach
S. Pointe Drive - Marea
S. Pointe Drive - Murano at Portofino
S. Pointe Drive - Portofino Tower
S. Pointe Drive - South Pointe Towers
S. Pointe Drive
Fifth Street to 23rd. Deco, Lincoln Road, Sunset Harbour and the ocean rows — the deepest and most liquid condo market on the island.
- 1 Hotel & Homes South Beach
24th Street - 1111 Residences
Lincoln Road - 1500 Ocean Drive
Ocean Drive - 321 Ocean
Ocean Drive - 350 Meridian
Meridian Avenue - ABAE 1215 on West
ON WEST CONDO HOTEL MIAMI BEACH 1215 West Avenue - Artecity
Park Avenue - Bentley Bay
West Avenue - Bentley Beach Hilton
Ocean Drive - Boulan South Beach
21st Street - Capri South Beach
16th Street - Carlyle Deco Hotel
Ocean Drive - Casa Grande South Beach
Ocean Drive - Decoplage South Beach
Lincoln Road - Five Park South Beach New
Five Park Miami Beach FIVE PARK PRE-CONSTRUCTION CONDOS 500 Alton Road - Glass Miami Beach
Ocean Drive - Icon South Beach
Alton Road - Il Villaggio
Ocean Drive - Louver House
Meridian Avenue - Miami Luxury Condos
Ocean Condos 57 OCEAN MIAMI CONDOS 5775 Collins Avenue - Mirador South Beach
West Avenue - Monad Terrace
Monad Terrace - Mondrian South Beach
West Avenue - Murano Grande
Alton Road - Ocean Five
Ocean Drive - Ocean House
Ocean Drive - Ocean Park South Beach
Ocean Drive - Ocean Place
Collins Avenue & 226 Ocean Drive - One Ocean
Collins Avenue - Palau Sunset Harbour
20th Street - Ritz Carlton Residences Miami Beach
N. Meridian Avenue - Roney Palace
Collins Avenue - Setai South Beach
20th Street - Shore Club Private Collection New
1901 Collins Avenue - Sixty 80 Design Hotel
DESIGN MIAMI CONDO HOTEL 6080 Collins Avenue - Sunset Harbour
Sunset Harbour Drive - Ten30 South Beach
15th Street - The Ambassadors
Michigan Avenue - The Cosmopolitan
Washington Avenue - The Courts Miami Beach
Jefferson Avenue - The Floridian
West Avenue - The Neville
Collins Avenue - The Waverly South Beach
West Avenue - The Yacht Club at Portofino
Alton Road - Three Hundred Collins
Collins Avenue - Twenty-Nine Indian Creek New
Indian Creek Drive - Urbin Miami Beach New
Washington Avenue - W South Beach
Collins Avenue
24th to 63rd. Faena, the Collins oceanfront towers and the gated island enclaves. Quieter, larger floor plates, and where a lot of the serious money moved.
- 42 Pine Miami Beach Condos New
West 42nd Street - 6000 Indian Creek
Indian Creek Drive - Aman Hotel & Residences New
Collins Avenue - Aqua Miami Beach
Aqua Avenue - Beach House 8
Collins Avenue - Blue & Green Diamond
Collins Avenue - Capobella
Collins Avenue - Caribbean
Collins Avenue - Faena Hotel Residences
Collins Avenue - Faena House
Collins Avenue - Fontainebleau Miami Beach
Collins Avenue - Mei Miami Beach
Collins Avenue - Mosaic Miami Beach
Collins Avenue - Terra Beachside Villas
Collins Avenue - The Bath Club
Collins Avenue - The Edition Residences at Miami Beach
Collins Avenue - The Perigon New
Perigon Miami Pre-Construction Condos 5333 Collins Avenue
63rd Street north. The last part of Miami Beach still trading below the island average, and the one actively being rezoned and rebuilt.
- 72 Park Miami Beach New
580 72nd Street - Akoya
Collins Avenue - Arte Surfside
Collins Avenue - Eighty Seven Park
Collins Avenue - L’Atelier Miami Beach
Collins Avenue - Monaco Yacht Club & Residences
Indian Creek Drive - Peloro Miami Beach
Indian Creek Drive - The Carillon
Collins Avenue
On the causeway between the Beach and the mainland. Bay views on both sides, and a ten-minute drive to Downtown.
- 1000 Venetian
Venetian Way - Belle Plaza
Island Avenue - Belle Tower
Island Avenue - Costa Brava
Island Avenue - Grand Venetian
Venetian Way - Island Terrace
Island Avenue - King Cole
Bay Drive - Nine Island
Island Avenue - Terrace Towers
Island Avenue
Where the top of the market went
While the broad market fell, the genuinely scarce assets rose. Fisher Island price per square foot went from $2,004 in Q1 2025 to $2,391 in Q1 2026 — up 19% in the same quarter that the surrounding market dropped 14.8%.
That is the pattern across Miami this cycle and it is worth internalising: the broad market is soft and the irreplaceable end of it is not. A gated private island with a fixed number of residences does not care much what the average oceanfront condo did last quarter. The same logic applies to Star Island, La Gorce and the deep-water North Bay Road lots.
If that end of the market is where you are looking, the Miami penthouses and waterfront homes guides go deeper on it.
Who Miami Beach suits right now
It suits a buyer who is willing to do building-level work rather than neighbourhood-level shopping. The 20/30/50 split means the reward for diligence here is unusually large — you are not choosing between similar assets at similar prices, you are choosing between sound buildings and impaired ones that look identical from the street.
It suits someone buying for a long hold. Inventory is being absorbed and no significant new supply is coming to the island proper; there is very little developable land left.
It suits trophy buyers, who are in a different market entirely and always have been.
It does not suit a buyer who wants to move quickly on price alone. The cheapest units on this island are cheap because of what is coming, not despite it.
How I would approach it
Miami Beach in 2026 rewards exactly one behaviour: pick the building first, then the unit. Volume is up, pricing is down 14.8%, inventory is being absorbed rather than accumulated, and half the stock is impaired. That combination produces genuine bargains and genuine traps sitting side by side, often on the same street, frequently at similar asking prices.
I have been selling Miami real estate since 2002 and have closed more than a billion dollars in property. Send me a building — yours, or one you are considering — and I will tell you plainly which of the three categories it falls into and what the association has actually voted on.
Get in touch, or read more about how I work. The Miami neighbourhoods map covers the alternatives.
Looking at Miami Beach?
From South of Fifth to Mid-Beach, the building decides the deal more than the block. Tell Josh what you want and he’ll send the recorded sales, the inventory, and the association issues worth knowing before you offer.
Miami Beach real estate: frequently asked questions
Is Miami Beach a buyer's market in 2026?
Yes, but a specific kind. Luxury condo price per square foot across the barrier islands fell 14.8% year over year in Q1 2026, from $1,382 to $1,178, while sales volume rose 5% and months of supply fell from 23 to 19. Prices down with volume up and inventory shrinking is a market clearing, not a market in trouble — sellers have repriced and buyers are transacting.
How much does a home cost in Miami Beach?
The Zillow Home Value Index for Miami Beach stood at $523,889 as of 31 May 2026, down 3.1% year over year, with median days to pending at 112. The median sale price was $570,333 through 30 April 2026 and the median list price $553,333 at the end of May — the list figure sitting below the sale figure is a sign sellers have already cut. Luxury condos across the barrier islands averaged $1,178 per square foot in Q1 2026.
Are Miami Beach condo prices falling?
On average yes, but the average conceals the real story. A Q1 2026 classification of the Miami condo market put roughly 20% of buildings strong, 30% stable and 50% weak. The 14.8% decline is not spread evenly — well-run, financeable buildings have largely held value while impaired ones have repriced sharply. Ask about the building, not the neighbourhood.
What should I check before buying a Miami Beach condo?
Five things, in order: whether the building is warrantable for conventional financing, which matters far more since Limited Review was eliminated on 3 August 2026; the milestone inspection report itself, not a summary; whether the association is genuinely funding reserves, required from 1 January 2026 for associations that had waived them; two years of board minutes for assessment history and anything voted but not yet levied; and a real windstorm and flood insurance quote on the specific unit. Units in buildings that cannot get conventional financing typically trade 15% to 30% below comparable units in eligible buildings.
Which part of Miami Beach is best?
They are genuinely different markets. South Beach offers the Art Deco district and the most walkability, with the widest variance in building quality. Mid-Beach is quieter, newer at the top end, and holds much of the strong-building inventory. North Beach is the least expensive and carries the most 1950s and 1960s stock still working through structural obligations. The Venetian and Sunset Islands are bayfront single-family with dockage, and Star Island, La Gorce and North Bay Road are the trophy addresses.
Is Miami Beach still a good investment?
In the right building, yes — arguably better than in several years, because the repricing has happened and inventory is being absorbed rather than accumulated, with almost no new supply possible on the island itself. But the 20/30/50 split means the average outcome and the good outcome are far apart. Fisher Island illustrates the top of that range: its price per square foot rose 19% year over year, from $2,004 to $2,391, in the same quarter the broader market fell 14.8%.
Sources
- Zillow — Miami Beach, FL housing market, updated 31 May 2026: Home Value Index, year-over-year change, days to pending, median sale and list prices.
Related coverage
Part of Miami Neighborhoods.