


Miami Luxury Condos · Belle Isle · Belle Plaza
Your tax assessment here will not look like the current owner’s.
By Josh Stein · Florida license SL3057661 · Updated 12 October 2026Leer en español →
No condos for sale at Belle Plaza right now.
- Months of inventory0.0
- Sold, 12 months4
Nearby Belle Plaza
40 listingsNearby Belle Plaza No units are for sale in Belle Plaza right now. These are condos for sale within 0.6 km, closest first.


Listing information is deemed reliable but is not guaranteed and is provided exclusively for consumers' personal, non-commercial use. Data is supplied by the MLS and may be subject to change or withdrawal without notice.
Last updated 1 second ago
Key facts about Belle Plaza
| Address | 20 Island Avenue, Miami Beach FL 33139 |
|---|---|
| For sale now | 0 |
| For rent now | 1 |
| Monthly HOA | $629 to $1,983 |
| Year built | 1962 |
| Neighborhood | Miami Beach |
Residences at Belle Plaza
| Bedrooms | For sale | Size (sq ft) | List price | Avg $/sq ft | Last sale |
|---|---|---|---|---|---|
| Studio | 0 | $398,500 (September 17, 2026) | |||
| 1 | 0 | $535,000 (July 21, 2026) | |||
| 2 | 0 | $1,070,000 (July 11, 2025) |
Unit lines
| Line | Records | Bedrooms | Size (sq ft) |
|---|---|---|---|
| 09 | 2 | 2 BR | 1,403 |
| 10 | 2 | 1 BR | 897 |
| 15 | 2 | Studio | 592 |
| 16 | 2 | 1 BR | 897 |
The last two digits of the unit number (05 in 305, 405, 505).
Verified 23 September 2026Miami-Dade County Property Appraiser1 source
On recorded 2026 sales this building runs $613 per square foot — cheaper than 90 of the 116 other buildings on the Miami Condo Index. Figures are closed sales from the Miami-Dade County Property Appraiser, not asking prices. Hover or tap a color to see the split.
Key Takeaways
- Belle Plaza recorded 5 sales in the 12 months to 23 September 2026 — at a median of $550,000, or $613 per square foot, on the Miami-Dade County Property Appraiser record. The latest recorded sale was on 17 June 2026. Own at Belle Plaza? Ask Josh what yours would sell for on WhatsApp.
- Your tax assessment here will not look like the current owner’s — homes last sold before 2005 are assessed at $269 per square foot; homes bought since 2021 at $507 — 89% higher for the same building.
- 222 homes at 20 Island Avenue on Belle Isle, with no commercial folios at all.
- The county record runs back to 1980 — 878 qualified sales in a continuous record.
- The people who bought at the 1980–83 conversion did extremely well — 151 of them have resold, at a median of +292%.
- The four-year rise is probably real, but I cannot confirm it at constant size — the 897 sq ft floorplate series rests on 9, 6 and 4 sales and shows no clean trend.
- 16.4% of all resales lost money: 108 of 657 on the 17 August county pull, with a median gain of 44.9% over a 6.2-year hold.
Belle Plaza, by the numbers
Recorded sales in the 12 months to 23 September 2026 ran from $515,000 to $900,000. Source: Miami-Dade County Property Appraiser.
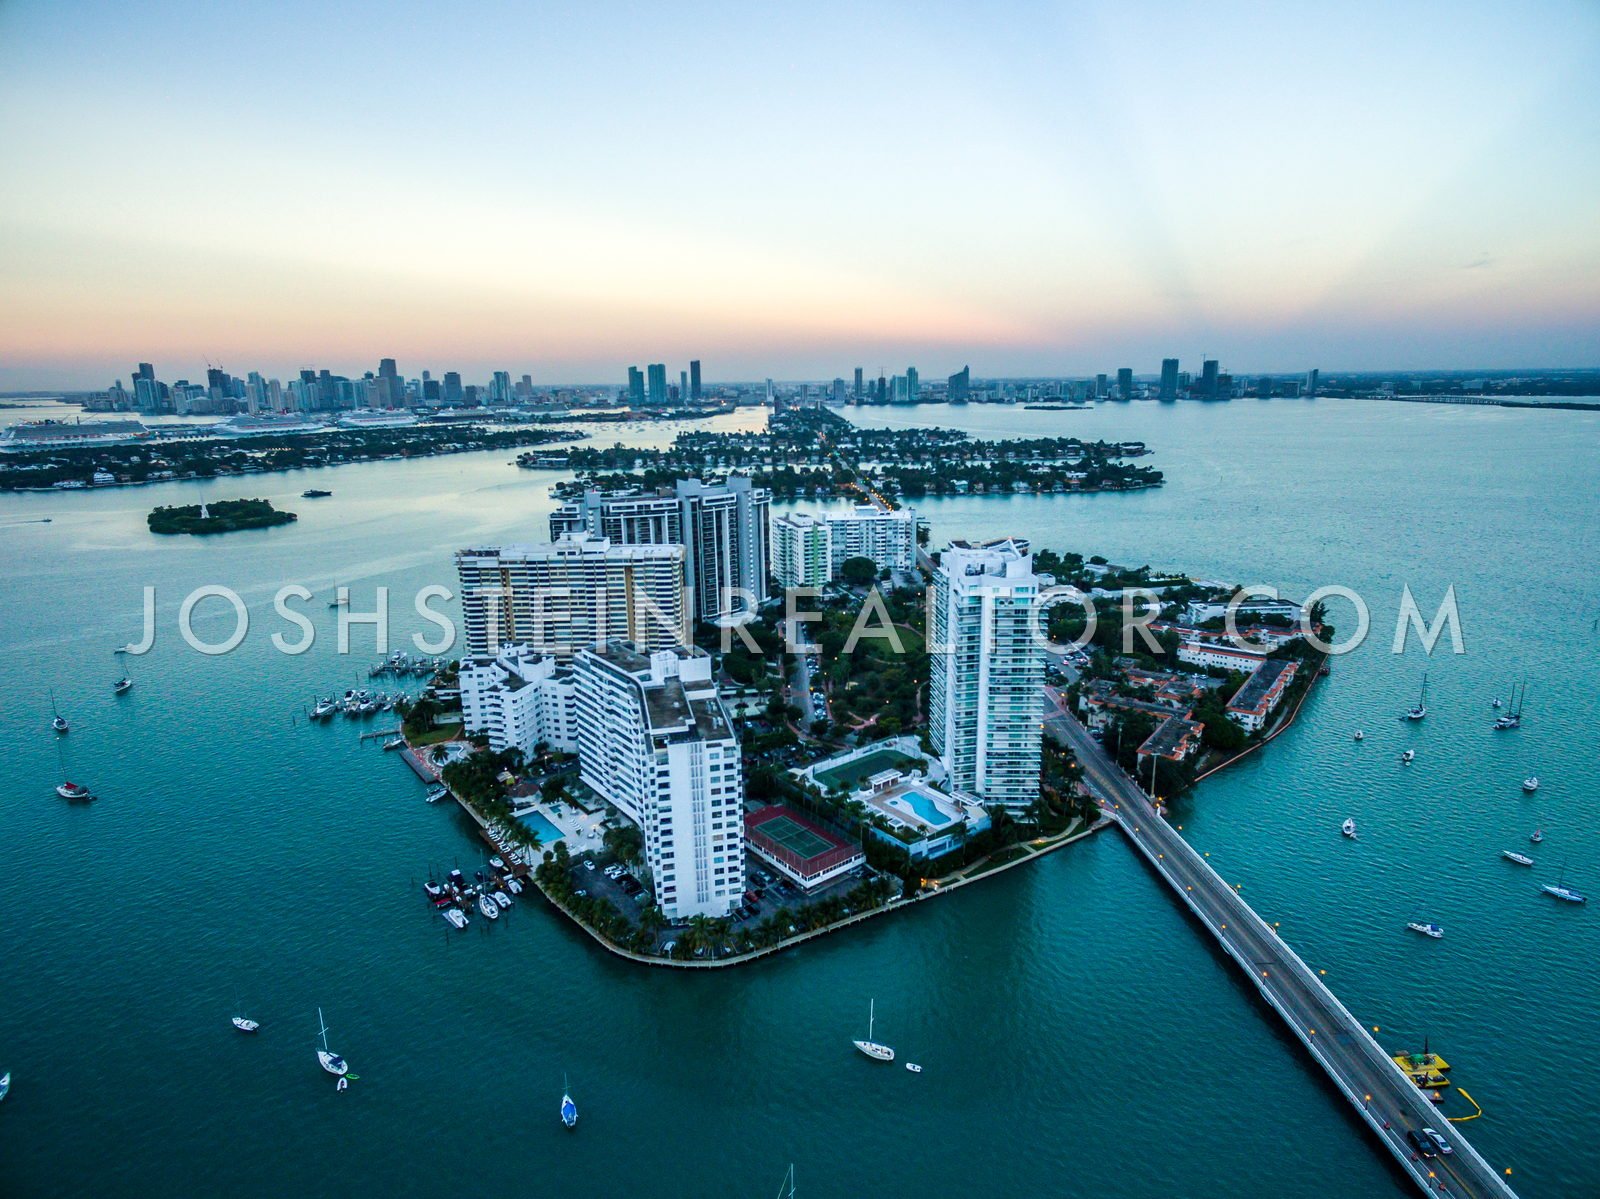
20 Island Avenue, Miami, Florida | Neighborhood: Belle Isle, Miami Beach
The thing the price table will not tell you
Most condo pages show you what homes sold for. Here is something the county record shows that price tables leave out, and that will affect what this building actually costs you to own.
Florida caps how fast an assessed value can rise for an owner who stays put. Sell, and it resets to market. Across the 222 homes here, that produces a spread you can measure directly:
| When the owner last bought | Homes | 2026 assessed value per sq ft |
|---|---|---|
| Never sold, or before 2005 | 53 | $269 |
| 2005–2014 | 43 | $454 |
| 2015–2020 | 51 | $510 |
| 2021 or later | 75 | $507 |
A buyer since 2021 is assessed 89% higher per square foot than a long-held owner in the same building — $507 against $269. The correlation between holding period and assessment runs at r = +0.534 across all 222 homes, which is strong enough that holding period, not the home itself, is doing most of the work in that spread.
What this means in practice: if you buy here, do not budget from the seller’s current tax bill. The number resets when you buy, and in this building the reset is large. I am deliberately not converting that into a dollar figure, because the millage rate is not in the Property Appraiser’s record and I will not state a tax number I cannot source.
This is not unique to Belle Plaza — it is Florida law, and it applies everywhere. It shows up unusually clearly here because more than a fifth of the building has not changed hands since before 2005.
What is actually inside the building
The county returns 223 folios at 20 Island Avenue: 222 residential homes and a single reference folio. There are no commercial units, no separately deeded parking and no storage folios , so every one of the 222 folios counted is a home.
The mix is 129 one-bedrooms, 70 two-bedrooms, 22 studios and one three-bedroom. Heated area runs 592 to 1,964 square feet with a median of 897.
102 of the 222 homes — 46% of the building — are exactly 897 square feet. That single repeated floorplate is what makes the analysis further down possible, and it is also a practical advantage: when you price a home here you are usually pricing against physically identical neighbours rather than against loose analogies.
The 2026 assessed values run $115,534 to $1,553,543, with a median of $438,361 — and per the section above, read that range as a record of when people bought as much as of what they own.
The record sale is $2,115,000 in August 2022, for a 1,844 square foot home at $1,147 per square foot — a high-floor line that sits well above the rest of the building.
A record that starts in 1980
The county holds 878 qualified sales here going back to 1980. That is a genuinely long continuous record — long enough to contain the 1980s, the 1990s, the 2000s bubble, the crash and everything since.
131 of those sales fall in 1980–83, at a median of $91,400 and $97 per square foot. That is the conversion era, when the building was sold off as individual homes.
151 of those early buyers have since resold in a measurable arm’s-length transaction. The median outcome was +292%. Even so, 41 of them — 27.2% — sold for less than they paid, which is a useful corrective to the idea that a forty-year hold guarantees anything. Timing the exit still mattered.
The strongest single outcome in the record: a home bought for $73,500 in August 1983 and sold for $1,100,000 in March 2025 — up 1,397% across forty-one years. Set against inflation and forty-one years of carrying costs that is less dramatic than it looks, but it is a real transaction on a real folio.
Across the whole record, the county shows 657 resales, of which 108 — 16.4% — lost money, at a median gain of 44.9% over a median hold of 6.2 years, on the 17 August pull.
The four-year trend, and how far I will go with it
Qualified sales from the Miami-Dade County Property Appraiser record, pulled 23 September 2026 — arm’s-length transactions only.
| Year | Qualified sales | Median price | Median $/sq ft |
|---|---|---|---|
| 2023 | 17 | $560,000 | $624 |
| 2024 | 10 | $590,000 | $679 |
| 2025 | 10 | $647,500 | $691 |
| 2026 to 23 September | 3 | $550,000 | $613 |
Through the last complete year that is $624 to $691, up 10.7%, and it is not obviously a size illusion. The median home sold was 897 square feet in 2023, in 2024 and in 2025. The mix did not shift, so the per-foot rise is not simply smaller homes trading.
So I can rule out the usual explanation. What I cannot do is confirm the trend on identical homes, and I want to be straight about why. Restricted to the 897 square foot floorplate, the series reads $624, $602, $641 — on 9, 6 and 4 sales. That is up, then down, then up, on single-digit samples. It neither confirms nor contradicts the 10.7%; it is simply too thin to rule either way.
Where that leaves me: the rise is probably real, because the mix genuinely did not move and the whole-building figure went up three years running. But I hold it more loosely than I would in a building trading eighty times a year, and anyone pricing off it should know it rests on 17, 10 and 10 sales rather than hundreds.
Where the evidence thins out
Three qualifications.
2026 rests on 3 sales in this table. They are the sales recorded through 23 September 2026, the latest on 17 June. The $550,000 median price and the $613 per-foot figure in that row are the arithmetic of three transactions. Draw nothing from the 2026 row. It is shown because suppressing it would be worse, not because it means anything.
Sales volume here is modest and falling. 17 qualified sales in 2023, 10 in 2024, 10 in 2025. Turnover works out at about one home in 22 per year. That is normal for a small, largely owner-occupied building, but it means fewer comparables than the raw 878-sale record might suggest.
Stories, amenities and monthly costs are not in this record and are not stated in the county figures here. The Property Appraiser knows what each home is, what it is worth and what it sold for. It does not know what the association charges, and given the assessment spread described above, the carrying cost here deserves your own diligence rather than my estimate.
Who this building suits
It suits a buyer who wants a one-bedroom on Belle Isle and cares more about a stable ownership record than a growth story. A median of $649 per square foot across the 40 sales since 2023 (23 September pull), in a band from $492 to $803, at a median price of $568,150, on a building where only 16.4% of 657 resales lost money, is a solid rather than exciting proposition — and solid is what the record actually supports.
It suits someone who intends to stay. The assessment structure rewards it directly: the 53 homes here that have not traded since before 2005 are carrying assessments 47% below what a 2021 buyer carries ($269 against $507 per square foot). That advantage accrues to whoever holds, and it is lost the moment the home changes hands.
It suits a short-hold investor poorly. Turnover of one home in 22 a year means you are not exiting quickly, the assessment resets against you on the way in, and the four-year trend — while probably positive — rests on too few sales to underwrite a rapid flip.
If you are selling here, your strongest argument is the 102 identical 897 square foot homes: find the most recent one that traded and price against it directly. Your weakest argument is the 878-sale record, which sounds impressive but mostly describes the 1980s and 1990s.
Own at Belle Plaza?
If you own here, this page already carries the county’s record of what homes in Belle Plaza have sold for. Here is how to use it.
Your three options
- Sell. Price against what comparable homes in the building have actually recorded, not against asking prices.
- Rent it out. Within the condominium’s rental rules, which vary from building to building.
- Hold. Watch the record: this page is updated from the county as new sales are posted.
What I will send you
Tell me your unit. I will send you the recorded sales of comparable homes in Belle Plaza, what they sold for per square foot, and a straight read on what yours could sell for today.
Two free things for owners
How this building compares: the Miami Condo Index ranks buildings by price per square foot and four-year change from the county record, the Miami Resale Record shows how often resales closed below the seller’s price, and the 100 Latest Sales list shows MLS closings as they post. Every building we cover is on the Miami Luxury Condos page.
Belle Plaza — Frequently Asked Questions
What have homes at Belle Plaza sold for in the last 12 months?
5 sales were recorded on the Miami-Dade County Property Appraiser record in the 12 months to 23 September 2026, at a median of $550,000 ($613 per square foot). The latest recorded sale was on 17 June 2026. These are recorded closings, not asking prices. If you own at Belle Plaza and want to know what your home would sell for, message Josh Stein on WhatsApp at (305) 695-8257.
Why will my property taxes be higher than the current owner’s?
Because Florida caps assessment increases while an owner stays put, and the assessment resets to market when the home sells. In this building the effect is measurable: the 53 homes last sold before 2005 are assessed at $269 per square foot, while the 75 bought since 2021 are assessed at $507 — 89% higher for homes in the same building. Budget from the reset value, not from the seller’s current bill.
What does the sale record show about Belle Plaza’s prices?
Median price per square foot went from $624 in 2023 to $691 in 2025, up 10.7%, and the median home sold was 897 square feet in all three years, so the rise is not simply smaller homes trading. It cannot be confirmed on the 897 sq ft floorplate alone, where the series rests on 9, 6 and 4 sales and shows no clean direction.
How many units are in Belle Plaza?
The county records 223 folios at 20 Island Avenue: 222 residential homes and one reference folio. There are no commercial units, no deeded parking and no storage folios. The mix is 129 one-bedrooms, 70 two-bedrooms, 22 studios and one three-bedroom.
How large are the homes?
Heated area runs from 592 to 1,964 square feet with a median of 897. That median is a floorplate rather than an average: 102 homes — 46% of the building — are exactly 897 square feet.
How far back does the sales record go?
To 1980. The county holds 878 qualified sales here, 131 of them in 1980–83 at a median of $91,400, which is the conversion era.
Did long-term owners here make money?
Mostly, and substantially. Of the 1980–83 buyers, 151 have resold and the median outcome was +292%. But 41 of them — 27.2% — still sold for less than they paid, so a long hold did not guarantee a gain. The strongest single result was $73,500 in 1983 to $1,100,000 in 2025, up 1,397%.
How easy is it to sell at Belle Plaza?
Slowly but predictably. Turnover runs at about one home in 22 per year, on 40 qualified sales in four years against 222 homes. The compensation is comparability: with 102 identical 897 square foot homes, there is usually a genuinely matched recent sale to price against.
Sources and further reading
Interested in selling at Belle Plaza in Miami Beach?
Learn more about selling your condo at Belle Plaza with Josh Stein.
Thinking about Belle Plaza?
I have sold South Florida property since 2002, more than $1 billion of it. Ask me for the recorded declaration, what has genuinely closed, or a straight answer on whether this building fits what you are after.
Josh Stein · Florida real estate sales associate, license SL3057661 · (305) 695-8257 · hello@joshsteinrealtor.comGet this building’s next recorded sale — before the listing sites catch up
- Every closed sale we can verify from the Miami-Dade record — price, date, and $/sqft when the deed supports it — not an IDX feed.
- Optional alert when a new deed posts in this building (or a short list of comps you choose).
- No spam inventory blasts. One building. One record. You decide what happens next.
Tell Josh which building. He’ll send the latest closed sales and set a quiet alert.
Get the sales recordRelated coverage
Part of Miami Luxury Condos.