

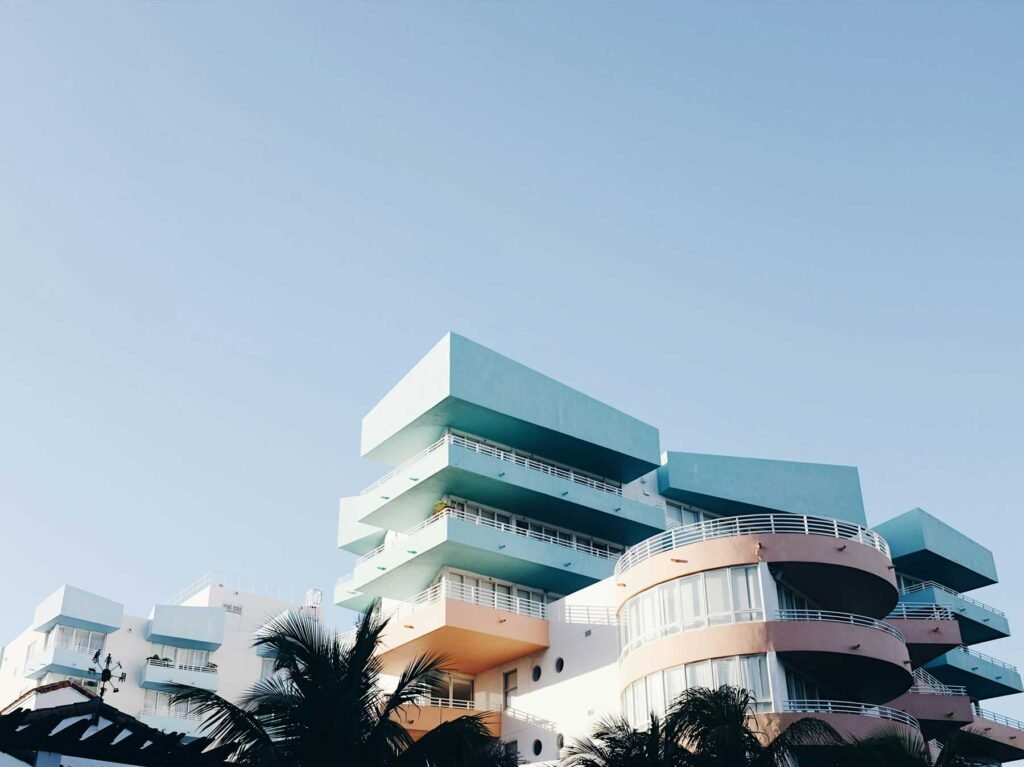
Miami Luxury Condos · South Beach · Ten30 South Beach
Thirty-one of its 32 homes sold in nine weeks.
By Josh Stein · Florida license SL3057661 · Updated 8 October 2026Leer en español →
Listings in Ten30 South Beach
3 listings


Listing information is deemed reliable but is not guaranteed and is provided exclusively for consumers' personal, non-commercial use. Data is supplied by the MLS and may be subject to change or withdrawal without notice.
Last updated 1 second ago
Recently sold in
4 listings


Verified 23 September 2026Miami-Dade County Property Appraiser1 source
On recorded 2025 sales this building runs $833 per square foot — more expensive than 63 of the 116 other buildings on the Miami Condo Index. Figures are closed sales from the Miami-Dade County Property Appraiser, not asking prices. Hover or tap a color to see the split.
Key Takeaways
- No sale at Ten30 South Beach was recorded in the 12 months to 23 September 2026 — on the Miami-Dade County Property Appraiser record. The latest recorded sale was on 9 May 2025. Own at Ten30 South Beach? Ask Josh what yours would sell for on WhatsApp.
- Thirty-one of its 32 homes sold in nine weeks — the sell-out ran from 11 February to 18 April 2022 and the last home followed on 17 June. The county records 35 qualified sales that year and then nothing at all in 2023.
- Three homes were resold inside the sell-out year at a profit — unit 319 went from $629,900 on 14 March 2022 to $800,000 on 2 May 2022 — up 27.0% in 49 days. Units 308 and 219 did the same thing at +22.5% and +17.5%.
- That window has closed — the most recent resale of penthouse PH4 sold on 25 June 2024 for $1,787,500 and again on 21 October 2024 for $1,600,000 — down 10.5% in 118 days.
- Read the per-foot column, not the price column — median price fell from $1,415,000 in 2024 to $710,000 in 2025, but that is entirely floorplate mix. Per square foot the move was $915 to $833, a fall of 9.0%.
- Over the four years it traded more often than the typical building in my index: nine qualified sales against 32 homes, about one home in 14 a year, against a median of one in 23 across the buildings in my Miami Condo Index. None of the nine fell in the last 12 months.
- One folio here is a food-processing plant — the county classifies a 7,350 sq ft unit in this condominium as light manufacturing and food processing, assessed at $619,469 for 2026. It is not a home and it is excluded from every figure on this page.
Ten30 South Beach, by the numbers
Developer: Shoma Group · Architect: Saladino Design Studios. Source: the building record on this site.
1030 15th Street, Miami Beach, Florida 33139 | Neighborhood: South Beach
What is actually in the building
The county returns 33 folios at 1030 15th Street. 32 are homes. The thirty-third is not a residence at all: the Property Appraiser classifies it as light manufacturing and food processing, 7,350 sq ft, assessed at $619,469 for 2026. It is a commercial unit inside the condominium, it is excluded from every figure on this page, and it is worth knowing about before you buy above it.
The homes are small by South Beach standards. They run from 714 sq ft to 2,216 sq ft, with a median of 930. The mix is 14 one-bedrooms, 15 two-bedrooms and three three-bedrooms, built on a handful of repeated floorplates: six homes at 751 sq ft, four at 738, four at 1,101, four at 1,476, three at 714 and two at 886. That repetition is useful: it means several homes here are directly comparable to each other.
For 2026 the county assesses the homes between $450,000 and $1,479,250, median $521,616.
The price record
| Year | Qualified sales | Median price | Median $/sq ft |
|---|---|---|---|
| 2023 | No qualified sales | ||
| 2024 | 6 | $1,415,000 | $915 |
| 2025 | 3 | $710,000 | $833 |
| 2026 to date | No qualified sales | ||
This table shows why median price is a bad number and median price per square foot is a good one. Read the price column and the building appears to have halved in a year. It did not. The six homes that sold in 2024 had a median size of 1,559 sq ft; the three that sold in 2025 had a median size of 975. Different homes sold, that is all. Per square foot the move was $915 to $833, a fall of 9.0% — real, but a tenth of what the price column implies.
Even that 9.0% is carried by three sales, so I would treat it as a soft signal rather than a measurement. What the four-year record supports is a level: nine qualified sales at a median of $903 per square foot, in a band from $728 to $1,034, at a median price of $1,100,000.
No four-year change is published and the building carries a dash in my Miami Condo Index. Two of the four years are empty. My rule is that a percentage change needs at least five qualified sales in the opening year and the closing year, and 2023 and 2026 have none.
The highest price the building has recorded is $2,000,000, paid on 5 January 2024 for penthouse PH1 at 2,216 sq ft — $903 per square foot. The highest per-foot price is a different sale and it needs flagging: unit 309, 1,101 sq ft, sold on 17 June 2022 for $1,420,000, or $1,290 per square foot. Three identically sized homes (209, 221 and 321) sold in the same building two to four months earlier at $862, $871 and $881 per square foot. I have no explanation on the county record for a 48% premium on an identical floorplate, and I am not going to invent one. It sits outside the four-year window and therefore affects none of the figures above, but a comparable pulled from 2022 could easily land on it.
What happened to the people who flipped it
Ten30 sold out fast. Thirty-one of its 32 homes recorded a qualified sale between 11 February and 18 April 2022 — nine weeks from the first to the last — and the thirty-second, unit 309, followed on 17 June. That sell-out produced something I can measure precisely: a group of buyers who tried to resell immediately.
Three of them did it inside the same calendar year, and all three made money.
| Home | Bought | Resold | Held | Change |
|---|---|---|---|---|
| 319 | $629,900 (14 Mar 2022) | $800,000 (2 May 2022) | 49 days | +27.0% |
| 308 | $979,900 (25 Feb 2022) | $1,200,000 (30 Jun 2022) | 125 days | +22.5% |
| 219 | $629,900 (18 Feb 2022) | $740,000 (14 Oct 2022) | 238 days | +17.5% |
Then the county record goes quiet for a full year. Not one qualified sale in 2023.
When trading resumed in 2024 the arithmetic had changed. Penthouse PH4 is the sharpest illustration: bought in the sell-out for $1,514,800 on 14 February 2022, resold for $1,787,500 on 25 June 2024 — an 18.0% gain over 28 months — and then resold again for $1,600,000 on 21 October 2024, down 10.5% in 118 days. The same home, the same year, the opposite result to 2022.
Across the whole record the county shows 12 resales here, three of them at a loss — a loss rate of 25.0%, against a median of 20.7% across the 83 buildings in my index where I have at least five resales to measure. The median Ten30 reseller is up 8.9% over a 2.1-year hold, against a corpus median gain of 21.5%. The honest summary is that this building’s owners have done slightly worse than average, over much shorter holds than average, which is what you would expect of a building where a quarter of the resales happened inside the sell-out year itself.
The other two losses were both small homes bought in the sell-out and held to 2025. Unit 301, 975 sq ft, went from $810,900 in February 2022 to $710,000 in February 2025 — down 12.4% over three years. Unit 207, 714 sq ft, went from $640,900 to $595,000 over the same period, down 7.2%. Both bought at $832 and $898 per square foot respectively, which were at the upper end of what the sell-out charged.
Who this building suits, and who it does not
It suits a buyer who wants a genuinely small, genuinely central South Beach home and is prepared to hold it. At a median of 930 sq ft and a median assessment of $521,616, the homes are small, and over the four years it traded more often than the typical building in my index (one home in 14 a year against an index median of one in 23), though nothing has sold in the last 12 months.
It suits a buyer who will check which floorplate they are buying and what the identical ones did. With six homes at 751 sq ft and four each at 738, 1,101 and 1,476, you can usually find a true comparable here. Use it.
It suits badly anyone buying on a two-year horizon. The 2022 flips worked; the 2024 flip did not, and lost 10.5% in four months. Nothing in this record supports a short hold.
It suits badly a buyer who wants a purely residential building. There is a food-processing and light-manufacturing unit of 7,350 sq ft inside this condominium on the county’s own classification, and whatever you think of that, you should know it before you sign rather than after.
If you are selling here, price from the per-foot record and not from the price record, because the price record is a trap that runs against you. Your building’s last nine sales cleared $728 to $1,034 per square foot, median $903, and the 2024 sales at $915 are the most representative recent evidence. Do not lean on the $1,290 per square foot that unit 309 achieved in June 2022 — it is unexplained, it is four years old, and any buyer’s agent who pulls the same record will see the three identical homes that sold at $862 to $881.
Own at Ten30 South Beach?
If you own here, this page already carries the county’s record of what homes in Ten30 South Beach have sold for. Here is how to use it.
Your three options
- Sell. Price against what comparable homes in the building have actually recorded, not against asking prices.
- Rent it out. Within the condominium’s rental rules, which vary from building to building.
- Hold. Watch the record: this page is updated from the county as new sales are posted.
What I will send you
Tell me your unit. I will send you the recorded sales of comparable homes in Ten30 South Beach, what they sold for per square foot, and a straight read on what yours could sell for today.
Two free things for owners
Ten30 South Beach — Frequently Asked Questions
What have homes at Ten30 South Beach sold for in the last 12 months?
None: no sale was recorded on the Miami-Dade County Property Appraiser record in the 12 months to 23 September 2026. The latest recorded sale was on 9 May 2025. With no recent closings, a price for a specific home depends on its line, floor and condition. If you own at Ten30 South Beach, message Josh Stein on WhatsApp at (305) 695-8257.
How many homes are there at Ten30 South Beach?
Thirty-two. The county returns 33 folios at 1030 15th Street, of which one is a commercial unit classified as light manufacturing and food processing. The undivided ownership shares across the folios sum to 100%, which confirms the record is complete.
How much does a home at Ten30 South Beach sell for?
On the nine qualified sales in the four years to September 2026, a median $903 per square foot in a band from $728 to $1,034, at a median price of $1,100,000. The most recent recorded sale was $1,100,000 in May 2025.
Are prices at Ten30 South Beach rising or falling?
Slightly down, on thin evidence. Median price per square foot went from $915 across six sales in 2024 to $833 across three in 2025, a fall of 9.0%. There were no qualified sales in 2023 and none so far in 2026, so no four-year change is published and the building carries a dash in my Miami Condo Index.
Why did the median price at Ten30 halve between 2024 and 2025?
It did not. Different sized homes sold. The 2024 sales had a median size of 1,559 sq ft and the 2025 sales a median of 975 sq ft. Measured per square foot — the only way to compare them — the fall was 9.0%, not 50%.
Have owners at Ten30 South Beach made money?
Most of them. The county records 12 resales, of which three sold for less than the owner paid — a 25.0% loss rate, against a median of 20.7% across the buildings in my index. The median reseller is up 8.9%, but over a short 2.1-year hold.
What is the highest price ever paid at Ten30 South Beach?
$2,000,000, on 5 January 2024, for penthouse PH1 at 2,216 sq ft — $903 per square foot. The highest price per square foot is separate: $1,290, paid for unit 309 in June 2022, which is 48% above the median of three identically sized homes that sold two to four months earlier and is unexplained on the county record.
When did Ten30 South Beach sell out?
Effectively in nine weeks. Thirty-one of the 32 homes recorded a qualified sale between 11 February and 18 April 2022 and the last one, unit 309, sold on 17 June. The county logged 35 qualified sales that year in total: the 32 first sales plus three homes resold within the same year, at gains of 17.5%, 22.5% and 27.0%.
Is there commercial space inside Ten30 South Beach?
Yes. One folio of 7,350 sq ft is classified by the Property Appraiser as light manufacturing and food processing, assessed at $619,469 for 2026. It is part of the same condominium and is excluded from every residential figure on this page.
Sources and further reading
Interested in buying at Ten30 South Beach?
Learn more about buying a condo at Ten30 South Beach with Josh Stein.
Thinking about Ten30 South Beach?
I have sold South Florida property since 2002, more than $1 billion of it. Ask me for the recorded declaration, what has genuinely closed, or a straight answer on whether this building fits what you are after.
Josh Stein · Florida real estate sales associate, license SL3057661 · (305) 695-8257 · hello@joshsteinrealtor.comGet this building’s next recorded sale — before the listing sites catch up
- Every closed sale we can verify from the Miami-Dade record — price, date, and $/sqft when the deed supports it — not an IDX feed.
- Optional alert when a new deed posts in this building (or a short list of comps you choose).
- No spam inventory blasts. One building. One record. You decide what happens next.
Tell Josh which building. He’ll send the latest closed sales and set a quiet alert.
Get the sales recordRelated coverage
Part of Miami Luxury Condos.