

Miami Luxury Condos · South of Fifth · One Ocean
Thirty-six of the 49 homes have a complete round trip on record.
By Josh Stein · Florida license SL3057661 · Updated 30 September 2026
Verified 21 August 2026Miami-Dade County Property Appraiser1 source
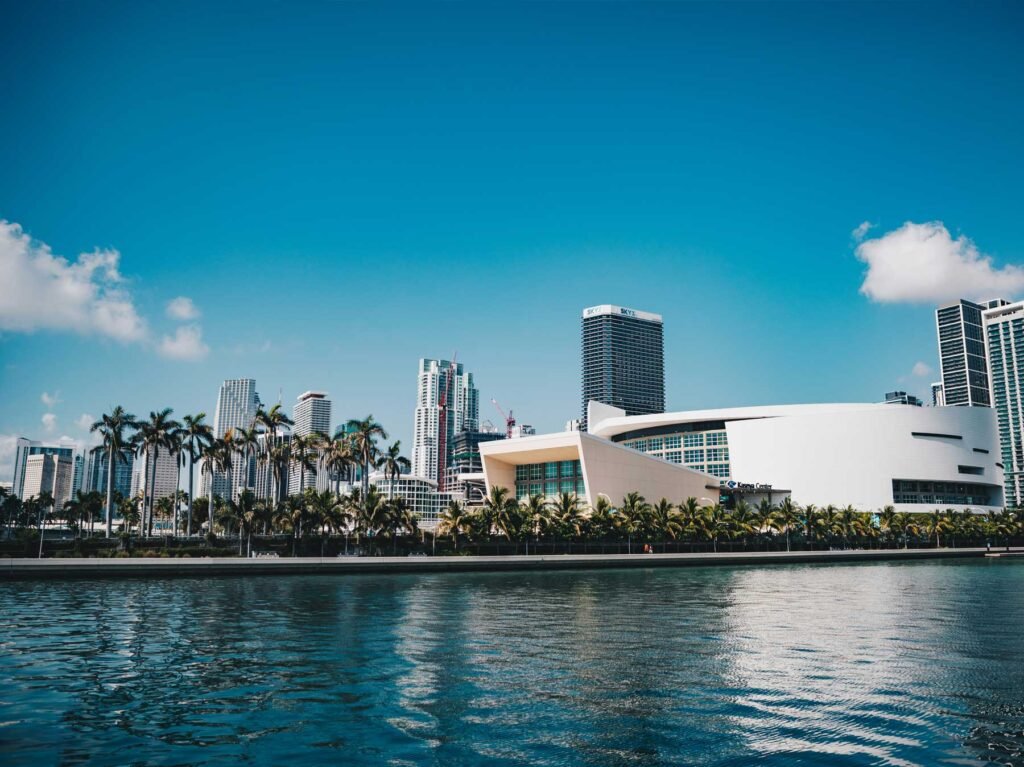
One Ocean — photography to follow
Key Takeaways
- One Ocean recorded 3 sales in the 12 months to 23 September 2026 — at a median of $3,850,000, or $1,885 per square foot, on the Miami-Dade County Property Appraiser record. The latest recorded sale was on 2 July 2026. Own at One Ocean? Ask Josh what yours would sell for on WhatsApp.
- Thirty-six of the 49 homes have a complete round trip on record — and every one of them starts at the 2016 sell-out — 29 gained, seven lost, a median of +20.6% over 5.9 years.
- What you paid mattered far more than which apartment you bought — the cheapest quarter of 2016 entries returned a median of +37.1% with no losses; the dearest quarter returned +0.6% with four losses in nine.
- The seventh floor is where the money was lost — three of its five completed round trips are down, and its median outcome is −2.8%.
- Not one qualified sale in the whole of 2023 — the county record is empty for that year — the only such gap in the four years measured here.
- This is two buildings under one declaration — 32 homes are recorded as South Building, 14 as North Building, and the common-element shares close at 100.0110%.
- The record sale is $10,000,000 — in June 2024, for a 3,339 square foot five-bedroom — $2,995 per square foot.
One Ocean, by the numbers
Developer: Related Group · Architect: Enrique Norten. Source: the building record on this site.
1 Collins Avenue, Miami Beach, Florida 33139 | Neighborhood: South of Fifth
What is actually inside the building
The Miami-Dade County Property Appraiser holds 54 folios at 1 Collins Avenue. Forty-nine of them are homes. The other five are three ground-floor commercial units of 5,468, 2,368 and 2,324 square feet, an aggregate reference folio, and a separate parking parcel. A raw folio count would overstate this building by five, which is worth knowing if you have seen a different number quoted.
It is also two buildings filed as one condominium. The county labels 32 of the homes South Building and 14 North Building, with three carrying no building label at all — one declaration, one set of common-element shares, closing at 100.0110%. Nothing is missing from this pull.
The homes run 818 to 5,586 square feet, with a median of 2,659 — a genuinely large median, and the reason this building’s prices look the way they do. The mix is 21 five-bedrooms and 21 three-bedrooms, with four two-bedrooms, two one-bedrooms and one four-bedroom.
What it does not have is repetition. The largest floorplate appears four times; every other one appears twice or once. Forty-nine homes, and almost no two of them the same. That matters more here than the headline numbers do, and I come back to it below.
The 2026 assessed values run $875,558 to $7,450,304, with a median of $3,589,009.
Why the entry price decided the outcome
Every completed round trip in this building begins in the same place. Forty-nine homes recorded their first qualified sale in 2016, most of them between late March and mid-June, at a median of $1,299 per square foot and a median price of $3,800,000.
Thirty-six of those buyers have since sold. Twenty-nine gained and seven lost, with a median of +20.6% over a median holding period of 5.9 years and a range from −22.4% to +64.6%.
Sorted by what each buyer paid per square foot in 2016, the pattern is hard to miss:
| 2016 entry price | Round trips | Median outcome | Losses |
|---|---|---|---|
| $916–$1,125 per sq ft | 9 | +37.1% | 0 |
| $1,126–$1,274 | 9 | +15.2% | 2 |
| $1,285–$1,481 | 9 | +34.8% | 1 |
| $1,544–$2,570 | 9 | +0.6% | 4 |
The buyers who paid the most per foot in 2016 are, as a group, roughly where they started. The buyers who paid the least are up more than a third. The median entry price among the seven losses is $1,544 per square foot; among the 29 gains it is $1,238.
By floor it lands in the same place. The seventh floor — the top of the building and the most expensive foot of it — is the only floor with a negative median, at −2.8%, and three of its five completed round trips are losses. Floors one, two, five and six have no losses at all.
Three that show the shape of it:
- A 2,125 square foot home bought for $2,100,000 in March 2016 sold for $3,395,000 in March 2025 — up 61.7%.
- An 818 square foot home bought for $750,400 in April 2016 sold for $1,160,000 in January 2018 — up 54.6% in 1.7 years.
- A 2,569 square foot home bought for $6,054,100 in April 2016 sold for $4,700,000 in August 2018 — down 22.4%.
That last home cost $2,357 per square foot in 2016. The first cost $988. They are in the same building, and the county record shows the difference between them was what the buyer agreed to pay, not which apartment they got. The record shows transactions and not reasons: it cannot tell you what any of these homes was worth, only what changed hands.
The price record
Qualified, arm’s-length sales from the county record, retrieved 21 August 2026.
| Year | Qualified sales | Median price | Median $/sq ft |
|---|---|---|---|
| 2023 | 0 | — | — |
| 2024 | 6 | $4,737,500 | $1,824 |
| 2025 | 4 | $5,112,500 | $1,926 |
| 2026 to date | 1 | $3,850,000 | $1,885 |
There was not one qualified sale at One Ocean in the whole of 2023. I am putting that on the page rather than showing three years and hoping nobody counts. It is the only such gap in the four years measured here, and it means the four-year record rests on eleven transactions in a 49-home building.
Eleven qualified sales in four years works out at about one home in eighteen each year — and with almost no repeated floorplates, a buyer here often has no direct comparable at all. That is the single most important practical fact about this building.
With eleven sales and an empty year in the middle, I would not draw a trend. The per-foot medians for 2024, 2025 and 2026 sit within about five per cent of each other, which is as close to flat as thin data can look; whether that is stability or coincidence, eleven sales cannot say.
The record sale is $10,000,000, on 24 June 2024, for a 3,339 square foot five-bedroom — $2,995 per square foot. That home did change hands in 2016 at $4,233,600, but the county flags that transfer as being between affiliated parties, so it is not counted as a purchase here and the home does not appear in the round-trip figures above.
Who this building suits
It suits a buyer who wants a large apartment in South of Fifth and knows exactly which one. With a median home of 2,659 square feet and a bedroom count skewed to five, this is not a building you buy for a pied-à-terre; the smallest home in it is 818 square feet and there is exactly one of them.
It suits a patient buyer. One home in eighteen trades each year, an entire calendar year passed without a single qualified sale, and the floorplates barely repeat — so the specific apartment you want may not come up for several years, and when it does you will be pricing it against thin evidence in both directions.
It suits a buyer who is disciplined about price above all. The clearest finding in this building’s ten-year record is that entry price, not apartment, decided the outcome — and the buyers who paid at the top of the range have not been rewarded for it. If you are being asked for a premium here, the county record gives you a specific reason to test it.
It suits a seller with a strong hand, provided the hand is honestly assessed. If you bought in the lower half of the 2016 range, the record is firmly with you. If you bought at the top of the building, the same record says a buyer’s agent will find four losses on the seventh floor and use them. Price against your own entry and your own square footage rather than the building median, which is built on eleven sales and swings with whichever home happened to trade. Ask me for the per-foot record on your line before you set a number.
One Ocean — Frequently Asked Questions
What have homes at One Ocean sold for in the last 12 months?
3 sales were recorded on the Miami-Dade County Property Appraiser record in the 12 months to 23 September 2026, at a median of $3,850,000 ($1,885 per square foot). The latest recorded sale was on 2 July 2026. These are recorded closings, not asking prices. If you own at One Ocean and want to know what your home would sell for, message Josh Stein on WhatsApp at (305) 695-8257.
Have owners at One Ocean made money?
Most have. Thirty-six of the 49 homes have a complete round trip in the county record, both legs qualified, and all 36 begin at the 2016 sell-out. Twenty-nine gained and seven lost, with a median of +20.6% over a median holding period of 5.9 years and a range from −22.4% to +64.6%.
Which buyers at One Ocean did worst?
The ones who paid the most. Sorted by 2016 price per square foot, the cheapest quarter of entries returned a median of +37.1% with no losses; the dearest quarter returned +0.6% with four losses in nine. The median entry price among the seven losses is $1,544 per square foot against $1,238 among the gains.
Is any floor at One Ocean worse than the others?
The seventh. It is the only floor with a negative median outcome, at −2.8%, and three of its five completed round trips are losses. Floors one, two, five and six have no losses at all. It is also the most expensive foot of the building, which is the same finding stated a different way.
Why are there no 2023 sales at One Ocean?
Because there were none. The county record holds no qualified, arm’s-length sale at this building in the whole of 2023. It is the only empty year in the four measured here, and it is why the four-year record rests on eleven transactions.
Is One Ocean one building or two?
Two buildings, one condominium. The county records 32 homes as South Building and 14 as North Building, with three unlabelled, all under a single declaration whose common-element shares close at 100.0110%.
What is the most expensive sale at One Ocean?
$10,000,000 on 24 June 2024, for a 3,339 square foot five-bedroom — $2,995 per square foot. That home also changed hands in 2016 at $4,233,600, but the county flags that transfer as between affiliated parties, so it is not treated as a purchase and the home is excluded from the round-trip figures.
How big are the homes at One Ocean?
From 818 to 5,586 square feet, with a median of 2,659. The mix is 21 five-bedrooms, 21 three-bedrooms, four two-bedrooms, two one-bedrooms and one four-bedroom. Floorplates barely repeat: the most common appears four times and every other one appears twice or once. The 2026 assessed values run $875,558 to $7,450,304, median $3,589,009.
Sources and further reading
Interested in selling at One Ocean?
Learn more about selling your condo at One Ocean with Josh Stein.
Thinking about One Ocean?
I have sold South Florida property since 2002, more than $1 billion of it. Ask me for the recorded declaration, what has genuinely closed, or a straight answer on whether this building fits what you are after.
Josh Stein · Florida real estate sales associate, license SL3057661 · (305) 695-8257 · hello@joshsteinrealtor.comGet this building’s next recorded sale — before the listing sites catch up
- Every closed sale we can verify from the Miami-Dade record — price, date, and $/sqft when the deed supports it — not an IDX feed.
- Optional alert when a new deed posts in this building (or a short list of comps you choose).
- No spam inventory blasts. One building. One record. You decide what happens next.
Tell Josh which building. He’ll send the latest closed sales and set a quiet alert.
Get the sales recordRelated coverage
Part of Miami Luxury Condos.