

Miami Luxury Condos · Miami Beach · The Bath Club
By Josh Stein · Florida license SL3057661 · Updated 10 October 2026Leer en español →
1 condo for sale at The Bath Club, list price $1,995.16 per sq ft.
- Asking range$8,250,000
- List price per sq ft$1,995.16
- Months of inventory12.0
- Sold, 12 months1


Listing information is deemed reliable but is not guaranteed and is provided exclusively for consumers' personal, non-commercial use. Data is supplied by the MLS and may be subject to change or withdrawal without notice.
Last updated 1 second ago
Key facts about The Bath Club
| Address | 5959 Collins Avenue, Miami Beach FL 33140 |
|---|---|
| For sale now | 1 |
| List price range | $8,250,000 |
| Size | 4,135 sq ft |
| Bedrooms | 4 BR |
| List price per sq ft | Average $1,995.16, low $1,995, high $1,995 |
| Monthly HOA | $2,102 to $9,324 |
| Year built | 2005 |
| Amenities | Beach Access, Beach Rights, Bike Storage, Billiard Room, Business Center, Clubhouse, Elevators, Fitness Center, Gated, Maintenance, Maintenance Grounds, Management, Playground, Pool, Security, Sidewalks, Spa Hot Tub, Tennis Courts, Trails, Trash |
| Neighborhood | Miami Beach |
Residences at The Bath Club
| Bedrooms | For sale | Size (sq ft) | List price | Avg $/sq ft | Last sale |
|---|---|---|---|---|---|
| 2 | 0 | $2,700,000 (April 27, 2026) | |||
| 3 or more | 1 | 4,135 | $8,250,000 | $1,995.16 | $3,250,000 (October 17, 2025) |
Recently sold in
4 listings


Verified 23 September 2026Miami-Dade County Property Appraiser1 source
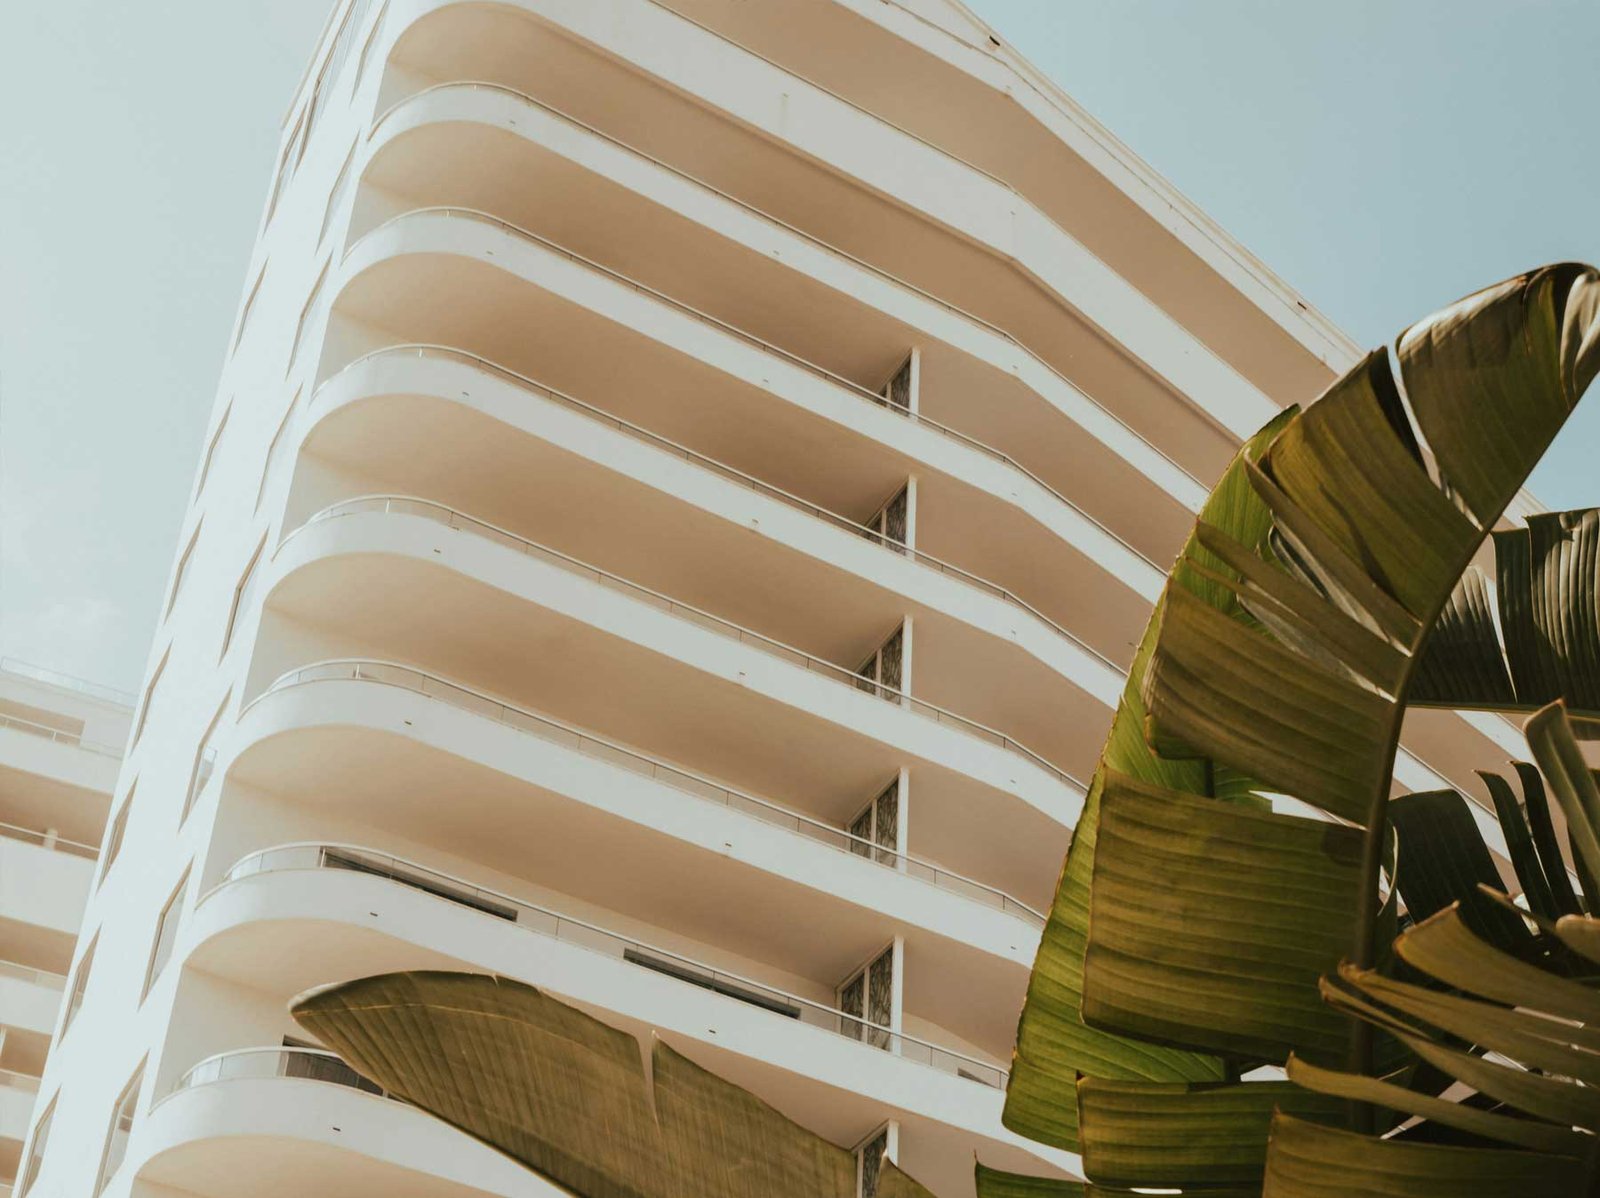
Building facts
- Address
- 5959 Collins Avenue
- Neighborhood
- Miami Beach
- Year built
- 2005
- Floors
- 20
- Residences
- 113
- Developer
- Peebles Development
- Architect
- Revuelta Vega Leon
- Status
- Delivered — completed 2005
On recorded 2026 sales this building runs $1,234 per square foot — more expensive than 90 of the 116 other buildings on the Miami Condo Index. Figures are closed sales from the Miami-Dade County Property Appraiser, not asking prices. Hover or tap a color to see the split.
Key Takeaways
- The Bath Club recorded 10 sales in the 12 months to 23 September 2026 — at a median of $4,347,500, or $1,287 per square foot, on the Miami-Dade County Property Appraiser record. The latest recorded sale was on 30 April 2026. Own at The Bath Club? Ask Josh what yours would sell for on WhatsApp.
- The headline number says this building fell 20.6% in four years. I do not believe it — and the county record contains the evidence against it. The nine sales of 2023 that set the base included five homes on the 17th floor or higher. The highest floor to trade in 2026 was the 12th.
- All six homes that sold in 2026 had sold before — and all six sold for more than their owner paid — gains of 3.5%, 5.9%, 36.0%, 40.0%, 80.0% and 144.4%. A building in a 20% decline does not do that.
- Height is worth 44% here — over the four years, homes on floors 18 and above cleared a median $1,701 per square foot, floors 10 to 17 cleared $1,424, and floors 1 to 9 cleared $1,181. Any comparison that does not hold the floor constant is measuring the floor.
- One home in 16 changes hands each year — 28 qualified sales across four years against 113 homes — comfortably more liquid than the median of one in 24 across the buildings in my Miami Condo Index.
- The record is $14,272,300 — paid on 5 January 2025 for a 5,685 sq ft villa at $2,511 per square foot. The same villa sold for $5,700,000 in July 2011 — a gain of 150.4% over thirteen and a half years.
- This is a big-home building — the median home is 3,640 sq ft and the smallest is 1,904. Six villas of 5,685 sq ft sit at the top, along with one 8,271 sq ft residence that the county records as units 2001, 2002 and 2003 combined.
The Bath Club, by the numbers
Developer: Peebles Development · Architect: Revuelta Vega Leon. Source: the building record on this site.
5959 Collins Avenue, Miami Beach, Florida 33140 | Neighborhood: Miami Beach
What is actually in the building
The county returns 114 folios for 5959 Collins Avenue. 113 are homes; the remaining one is a reference folio carrying no dwelling. There is no separately filed parking, cabana or storage stock and no commercial folio.
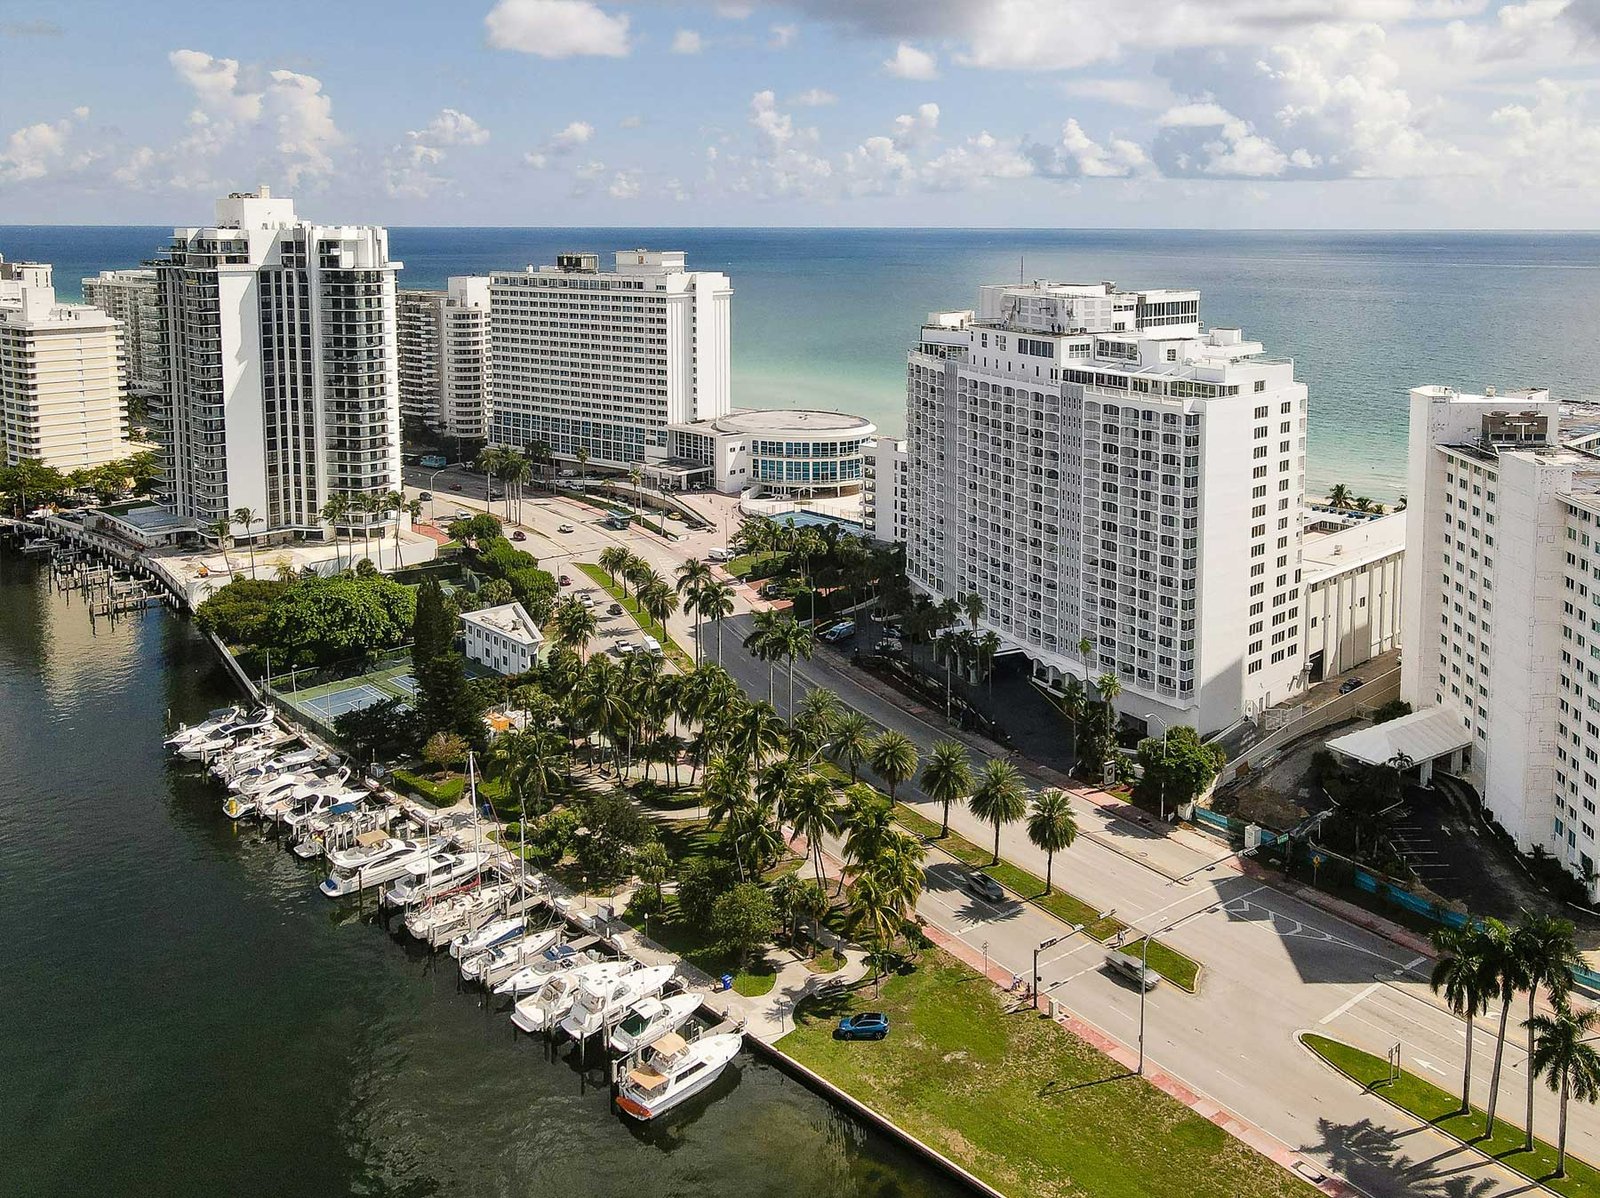
This is a large-home building by any measure. The residences run from 1,904 sq ft to 8,271 sq ft, median 3,640. Six floorplans carry most of the building — 14 homes each at 3,807, 3,982 and 4,135 sq ft, 13 at 3,640, and twelve each at the two smallest plans of 1,904 and 2,059 sq ft. At the top sit six villas of 5,685 sq ft and a single 8,271 sq ft residence that the county records as units 2001, 2002 and 2003 held together, with seven bedrooms.
The bedroom mix is 12 one-bedrooms, 36 two-bedrooms, 46 three-bedrooms, 17 four-bedrooms and that one seven-bedroom. One villa carries no bedroom count in the county record at all; I have left it as the county has it rather than guess.
For 2026 the county assesses the homes between $933,274 and $10,646,080, median $3,688,850.
Did The Bath Club really fall 20.6%?
Run the arithmetic I run on every building and the answer is yes. The median price per square foot was $1,555 in 2023 and $1,234 in 2026 — a fall of 20.6%, on nine sales at one end and six at the other, comfortably clearing the five-sale threshold I require before publishing a four-year change. On the published method, that number goes in my Miami Condo Index.
This page is the caveat that goes with it, and I would rather write it than let the number stand alone.
Start with where the sales happened, because in this building height is not a detail.
| Floors | Qualified sales 2023–2026 | Median $/sq ft |
|---|---|---|
| 18 and above | 7 | $1,701 |
| 10 to 17 | 10 | $1,424 |
| 1 to 9 | 10 | $1,181 |
A home on the 18th floor or above clears 44.0% more per square foot than one on the lower nine. Now look at what actually traded in each year. The nine sales of 2023 were on floors 6, 6, 7, 9, 17, 18, 18, 19 and 20 — five of them on the 17th floor or higher. The six sales of 2026 were on floors 7, 7, 9, 10, 10 and 12. The highest floor to trade in the whole of 2026 was the 12th.
So the base year is loaded with the expensive half of the building and the final year contains none of it. That alone would produce a large apparent fall in a building where nothing had changed.
Then hold the line constant, which is the closest this building gets to a controlled comparison. Line 01 — the 2,059 sq ft plan — traded twice in 2023 and three times in 2026. In 2023: floor 6 at $826 per square foot, floor 17 at $1,185. In 2026: floor 7 at $874, floor 10 at $1,020, floor 12 at $1,311. The 2026 sale on the 12th floor beat the 2023 sale on the 17th by 10.6%, and the 2026 sale on the 7th beat the 2023 sale on the 6th by 5.8%. Same line, same floorplan, floor for floor: 2026 is higher than 2023, not 21% lower.
And then the strongest evidence available anywhere in property data — the same home selling twice. All six homes that changed hands in 2026 had sold before, and every one of them sold for more than its owner paid: unit 1007 up 3.5% over 10.6 years, unit 701 up 5.9% over 4.4, unit 907 up 36.0% over 1.6, unit 1001 up 40.0% over 8.6, unit 1201 up 80.0% over 5.1 and unit 705 up 144.4% over 15.2. Widen it slightly and the picture holds: of the 14 homes whose second sale landed in 2025 or 2026, thirteen gained and one lost, at a median of +51.2%.
My honest reading is that this building has not fallen 20.6%; the sample has moved down the tower. That is a different statement from saying prices are rising — two homes did resell at a loss inside the window, unit 1802 down 6.0% between March 2023 and April 2024 and unit 1003 down 5.7% between February 2024 and April 2025, both on short holds at the top of the market. The fair summary is a building trading roughly flat to modestly higher on a like-for-like basis, whose published median has been dragged down by which floors came to market.
I have left the index figure as the method produces it rather than quietly adjusting it, because a method you override whenever you dislike the answer is not a method. The correct use of this page is as the evidence that the index number needs.
The price record
| Year | Qualified sales | Median price | Median $/sq ft |
|---|---|---|---|
| 2023 | 9 | $4,050,000 | $1,555 |
| 2024 | 5 | $4,855,000 | $1,641 |
| 2025 | 8 | $5,425,000 | $1,362 |
| 2026 to date | 6 | $3,550,000 | $1,234 |
Across the four years the building cleared a median $1,479 per square foot, in a band from $728 to $2,511, at a median price of $4,525,000. That band is wide, and the previous section explains most of it: the bottom of the range is a sixth-floor home and the top is a villa.
The record is $14,272,300, paid on 5 January 2025 for one of the six 5,685 sq ft villas at $2,511 per square foot. It is worth following that home back: the same villa sold for $5,700,000 in July 2011, so its owner realized a gain of 150.4% over thirteen and a half years. The county assesses it at $10,646,080 for 2026, the highest figure in the building.
Liquidity is a real strength. Twenty-eight qualified sales against 113 homes is about one home in 16 per year, better than the median of one in 24 across the buildings in my Miami Condo Index. In a building where floor is worth 44%, that matters more than usual: it means a genuine chance of finding a comparable on a similar floor rather than being forced to argue from the building average.
The long record: the building sold through in 2005, when 101 homes changed hands at a median $1,730,000, or $487 per square foot. Across every resale pair the county has recorded since, 189 of them, 26 lost money, or 13.8%, at a median gain of 31.8% over a 4.7-year hold. Two pairs that span a foreclosure are not chained and are left out. That loss rate is unremarkable in itself; what makes it worth stating is that the losses are concentrated in short holds bought near peaks, while the long holds have done very well indeed.
Who this building suits, and who it does not
It suits a buyer who wants scale on the sand and intends to hold. The median home here is 3,640 sq ft, and the long-hold record is strong. Among the homes that resold in 2025 and 2026, the five bought longest ago — one each in 2005, 2008 and 2010, and two in 2011 — realized 115.3%, 112.5%, 77.4%, 144.4% and 150.4%.
It suits a buyer who is prepared to pay for height, or who is deliberately not. The 44% spread between the top and bottom floor bands is wide, and it is stable enough across the four-year record to plan around. If the view is not what you are buying, the lower floors here are the value in this building and they trade often enough that you will get a chance at one.
It suits badly a buyer who wants a small home. There are 24 homes under 2,100 sq ft and nothing under 1,904, so the entry tier is narrow.
It also suits badly anyone who takes headline building statistics at face value — and I include my own index in that. If you read that The Bath Club is down 20.6% and conclude the building is in trouble, you will misprice it in both directions.
If you are selling here, this page is the argument you need and you should use it directly. A buyer’s agent will quote the four-year decline, and the answer is the floor table and the 2026 resales: every home that sold in 2026 sold above what its owner paid, and the highest floor that traded all year was the twelfth. If your home is above the twelfth floor, there is no 2026 evidence in this building for what it is worth — the nearest comparables are 2023 and 2025 sales at $1,555 to $1,701 per square foot, and any argument from the 2026 median is an argument about low floors, not about your home.
Own at The Bath Club?
If you own here, this page already carries the county’s record of what homes in The Bath Club have sold for. Here is how to use it.
Your three options
- Sell. Price against what comparable homes in the building have actually recorded, not against asking prices.
- Rent it out. Within the condominium’s rental rules, which vary from building to building.
- Hold. Watch the record: this page is updated from the county as new sales are posted.
What I will send you
Tell me your unit. I will send you the recorded sales of comparable homes in The Bath Club, what they sold for per square foot, and a straight read on what yours could sell for today.
Two free things for owners
The Bath Club — Frequently Asked Questions
What have homes at The Bath Club sold for in the last 12 months?
10 sales were recorded on the Miami-Dade County Property Appraiser record in the 12 months to 23 September 2026, at a median of $4,347,500 ($1,287 per square foot). The latest recorded sale was on 30 April 2026. These are recorded closings, not asking prices. If you own at The Bath Club and want to know what your home would sell for, message Josh Stein on WhatsApp at (305) 695-8257.
Have prices at The Bath Club fallen?
The published arithmetic says the building is down 20.6% per square foot between 2023 and 2026, and that figure appears in my Miami Condo Index because it clears my five-sale threshold at both ends. I do not think it describes the market. Every one of the six homes that sold in 2026 had sold before, and all six sold for more than their owner paid; and the highest floor to trade in 2026 was the 12th, against five sales on the 17th floor or above in 2023. Like for like, the building is roughly flat to modestly higher.
How much is a higher floor worth at The Bath Club?
A great deal. Over the four years to September 2026, homes on the 18th floor and above cleared a median $1,701 per square foot, floors 10 to 17 cleared $1,424, and floors 1 to 9 cleared $1,181 — a 44.0% spread from bottom band to top. Any comparable that is not matched on floor is measuring the floor rather than the home.
How big are the homes at The Bath Club?
From 1,904 sq ft to 8,271 sq ft, median 3,640. The most common plans are 3,807, 3,982 and 4,135 sq ft with 14 homes each, and 3,640 sq ft with 13. Six villas measure 5,685 sq ft, and one residence of 8,271 sq ft is recorded by the county as units 2001, 2002 and 2003 combined. The bedroom mix is 12 one-bedrooms, 36 two-bedrooms, 46 three-bedrooms, 17 four-bedrooms and one seven-bedroom.
What is the highest price ever paid at The Bath Club?
$14,272,300, on 5 January 2025, for a 5,685 sq ft villa at $2,511 per square foot. The same villa had sold for $5,700,000 in July 2011, a gain of 150.4% over thirteen and a half years.
How often do homes at The Bath Club change hands?
The county records 28 qualified sales in the four years to September 2026 against 113 homes — about one home in 16 a year, better than the median of one in 24 across the buildings in my Miami Condo Index.
Have owners at The Bath Club made money?
Most have. The building sold through in 2005, with 101 homes changing hands at a median $1,730,000. Across the 189 resale pairs recorded since, 26 lost money, which is 13.8%, at a median gain of 31.8% over a 4.7-year hold. Of the 14 homes whose second sale landed in 2025 or 2026, thirteen gained and one lost, at a median of +51.2%.
What should a seller at The Bath Club know?
That the building’s own headline number will be used against you and that the record answers it. If your home is above the 12th floor, no 2026 sale in this building is a comparable for it — nothing that high traded all year. The nearest evidence is the 2023 and 2025 sales at $1,555 to $1,701 per square foot, and the fact that every 2026 sale here was a resale at a gain.
Sources and further reading
Interested in selling at The Bath Club?
Learn more about selling your condo at The Bath Club with Josh Stein.
Thinking about The Bath Club?
I have sold South Florida property since 2002, more than $1 billion of it. Ask me for the recorded declaration, what has genuinely closed, or a straight answer on whether this building fits what you are after.
Josh Stein · Florida real estate sales associate, license SL3057661 · (305) 695-8257 · hello@joshsteinrealtor.comGet this building’s next recorded sale — before the listing sites catch up
- Every closed sale we can verify from the Miami-Dade record — price, date, and $/sqft when the deed supports it — not an IDX feed.
- Optional alert when a new deed posts in this building (or a short list of comps you choose).
- No spam inventory blasts. One building. One record. You decide what happens next.
Tell Josh which building. He’ll send the latest closed sales and set a quiet alert.
Get the sales recordRelated coverage
Part of Miami Luxury Condos.