

Miami Luxury Condos · South Beach · The Waverly South Beach
By Josh Stein · Florida license SL3057661 · Updated 30 September 2026
Verified 17 August 2026Miami-Dade County Property Appraiser1 source
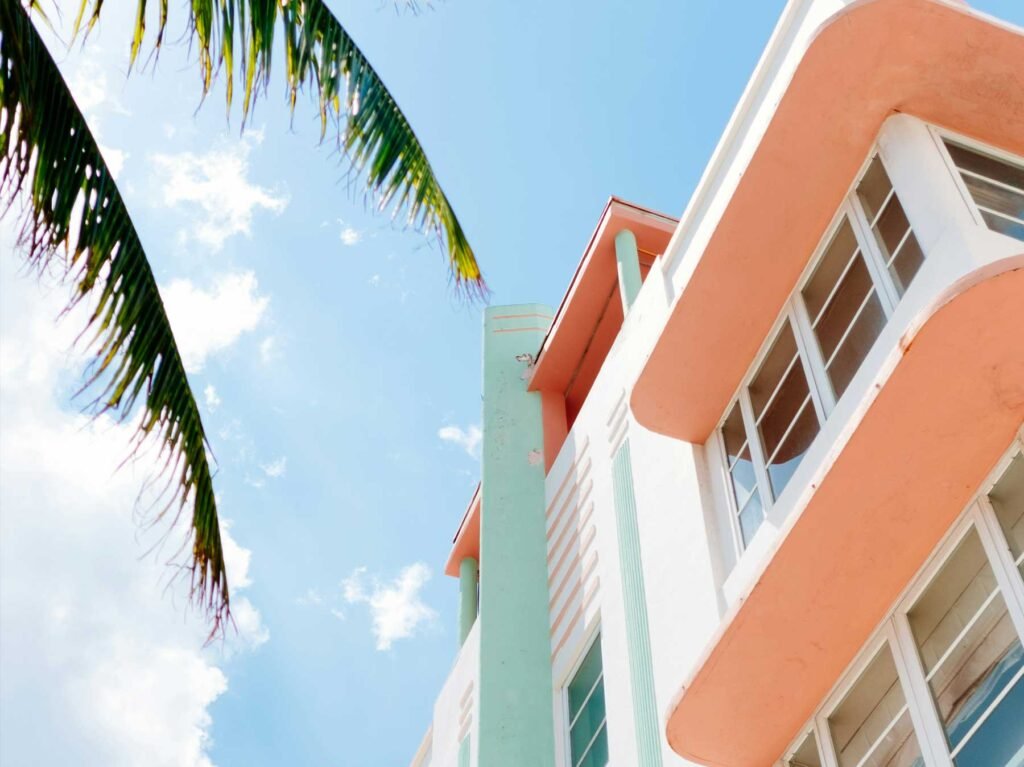
The Waverly South Beach — photography to follow
Building facts
- Address
- 1330 West Avenue
- Neighborhood
- Miami Beach
- Year built
- 2001
- Floors
- 36
- Residences
- 395
- Developer
- Athena Karlton
- Architect
- Arquitectonica
- Status
- Delivered — completed 2001
On recorded 2026 sales this building runs $658 per square foot — cheaper than 81 of the 117 buildings on the Miami Condo Index. Figures are closed sales from the Miami-Dade County Property Appraiser, not asking prices. Hover or tap a colour to see the split.
Key Takeaways
- The Waverly South Beach recorded 14 sales in the 12 months to 23 September 2026 — at a median of $708,250, or $653 per square foot, on the Miami-Dade County Property Appraiser record. The latest recorded sale was on 30 June 2026. Own at The Waverly South Beach? Ask Josh what yours would sell for on WhatsApp.
- Price per square foot fell 11.2% across four years — from $741 in 2023 to $658 in 2026 to date — but almost the entire move happened in a single step between 2023 and 2024.
- Since that step the building has been flat — $662, then $657, then $658. Three years of essentially unchanged per-foot pricing is a steadier record than the headline decline suggests.
- The 17.4% fall in median sale price is not the same number — and not the same story — 2026’s median rose while the per-foot figure did not, which is a change in which homes sold, not in what they are worth.
- 64 qualified sales across four years — is a deep sample for one building, and works out at roughly one home in twenty-five trading annually.
- One home here has sold four times since 2004 — and its 2026 price came in 2.1% BELOW what the same unit fetched in 2018 — the cleanest read available on this building, because the home never changed.
- 275 of the 395 homes are two-bedrooms — and only three homes in the entire building exceed 2,000 square feet.
1330 West Avenue, Miami Beach, Florida 33139 | Neighborhood: South Beach
What the county record shows at 1330 West Avenue
The Miami-Dade County Property Appraiser carries 404 folios under THE WAVERLY AT SOUTH BEACH CONDO. Of those, 395 are residential homes and 9 are commercial units, recorded as CU-101 through CU-BD. Those two counts account for every folio in the pull, which is not always the case — in some towers I have to report a remainder I cannot classify. Here I do not.
Worth noting what is absent: this building has no separately deeded parking folios. That sounds like trivia, but it changes how the sales record reads, and I will come back to it.
The bed mix is lopsided in a way the marketing language around this stretch of West Avenue rarely conveys. Of the 395 homes, 275 are two-bedrooms and 117 are one-bedrooms. That is 99.2% of the building. The entire remaining inventory is one three-bedroom and two four-bedrooms. If you want a large home in this building, you are shopping a field of three.
Heated area runs from 793 to 2,949 square feet, with a median of 1,127. Only three homes clear 2,000 square feet. The floorplates repeat heavily: 110 homes are 1,262 square feet, and four further plans: 793, 806, 1,084 and 1,127 square feet, account for 56 homes each. A building this repetitive is easier to value, because genuine like-for-like comparables exist in quantity.
2026 assessed values across the 395 homes run from $75,007 to $1,567,167, median $571,968, with a quarter of the building assessed below $434,031. That is a twenty-one-fold spread in a building whose homes vary in size by less than four. Assessed value in Florida tracks assessment history rather than current market value, so a long-held home and its identical neighbour can sit far apart on the roll. Read the assessed column as a record of when homes last changed hands, not as a price guide.
Four years of sales, and the step that explains them
The county shows 64 qualified, arm’s-length sales here across the last four years. Bulk and portfolio transfers are already excluded from that count, and identical same-day transactions collapsed to one. This is a real sample, not a handful of trades I have to hedge around.
| Year | Qualified sales | Median price | Median $/sq ft |
|---|---|---|---|
| 2023 | 22 | $892,000 | $741 |
| 2024 | 17 | $650,000 | $662 |
| 2025 | 18 | $644,500 | $657 |
| 2026 to 17 August | 7 | $736,500 | $658 |
Read the right-hand column first, because it is the one that compares like with like. Per square foot, the building went $741, $662, $657, $658. That is a fall of 11.2% across the four years — and 10.7 of those points landed in one step, between 2023 and 2024. Since that step, three consecutive years have printed within a dollar of each other. The honest description is not a building in decline. It is a building that repriced once and has held the new level ever since.
Now read the middle column, and it tells you something different: median sale price down 17.4%, from $892,000 to $736,500, with a jump back up in 2026. Both columns are correct. They are measuring different things. Median price answers “what did the homes that happened to sell cost”, and in a building where the plans run from 793 to 2,949 square feet, that answer moves whenever the mix moves. In 2026 the mix moved: seven sales spanning $530,000 to $2,350,000 pulled the median up 14.3% while the per-foot figure moved two tenths of one percent. Nothing revalued. Bigger homes sold.
My honest reading of the direction: flat. My honest reading of the magnitude in 2026: unreliable. Seven sales is less than a third of what 2023 recorded, the year is incomplete, and I would not put weight on a single year at that count. The three complete years since the 2024 step are the part of this table I would actually trade on.
One home, sold four times since 2004
There is a better measurement available in this building than any median, and it exists because one home keeps coming back to market. Folio 02-3233-069-0310 — Unit 3601, three bedrooms, 2,582 square feet — appears in the qualified sales record four times:
| Date | Price | $/sq ft |
|---|---|---|
| April 2004 | $1,000,000 | $387 |
| July 2005 | $1,450,000 | $562 |
| January 2018 | $2,400,000 | $930 |
| April 2026 | $2,350,000 | $910 |
This is a repeat-sale series on a single unchanged home, which removes the floorplate-mix problem entirely. It shows the same home up 45.0% in fifteen months during 2004–2005, up 65.5% over the twelve and a half years to 2018, and then down 2.1% between January 2018 and April 2026. Eight years, and the top of this building came back slightly below where it was.
I want to be careful about how much weight one home carries. This is a single unit, it is one of only three homes here above 2,000 square feet, and its condition and finish in 2026 are not in the county record — a home can sell for less because of what was done to it, or not done to it, and the roll will never tell you. What the series does establish is that the flatness in the per-foot table is not an artefact of which homes sold. On the one home where the mix cannot move, the answer is the same.
That April 2026 sale is also the highest qualified price in the building’s four-year window, and it sits 2.1% under the highest qualified sale in the county record for this building, which is the January 2018 transaction on the very same home.
Who does this building actually suit?
It suits a buyer who wants a two-bedroom on this stretch of West Avenue and cares about being able to check the price. With 275 two-bedrooms, heavy floorplate repetition and 64 sales in four years, there are genuine comparables here, and roughly one home in twenty-five trades annually. Entry and exit are both realistic.
It suits a buyer who values a settled price level over a rising one. Three years of flat per-foot pricing after a single step down is a defensible place to buy; it is not a growth story, and I would not sell it as one.
It suits a large-home buyer badly. Three homes above 2,000 square feet means you are waiting for a specific unit, not choosing between options, and the repeat-sale history on one of them (Unit 3601) is flat-to-down over eight years.
If you are selling here, the number to watch is the per-foot figure, not the building’s median. A neighbour’s headline price says almost nothing about your home unless the square footage matches, and in a building with a handful of heavily repeated floorplates you can find the matching comparable. Price against the $658 level the last three years have established, adjusted for your own plan and floor — and if you are told the building is down 17%, that is the mix talking, not your home.
Waverly South Beach — Frequently Asked Questions
What have homes at The Waverly South Beach sold for in the last 12 months?
14 sales were recorded on the Miami-Dade County Property Appraiser record in the 12 months to 23 September 2026, at a median of $708,250 ($653 per square foot). The latest recorded sale was on 30 June 2026. These are recorded closings, not asking prices. If you own at The Waverly South Beach and want to know what your home would sell for, message Josh Stein on WhatsApp at (305) 695-8257.
How many homes are in Waverly South Beach?
The county record carries 404 folios, of which 395 are residential homes and 9 are commercial units. 275 of the homes are two-bedrooms and 117 are one-bedrooms.
Have prices at Waverly South Beach gone down?
Per square foot, yes — 11.2% across four years, from $741 in 2023 to $658 in 2026 to date. But 10.7 of those points happened in one step between 2023 and 2024, and the three years since have printed $662, $657 and $658. The building repriced once and has held that level.
Why does the median sale price show a bigger fall than the per-foot figure?
Because median price measures which homes sold, not what they are worth. Homes here range from 793 to 2,949 square feet, so the median moves with the mix. In 2026 the median rose 14.3% while the per-foot figure moved 0.2% — larger homes sold, nothing revalued.
What is the most expensive sale on record at Waverly South Beach?
$2,400,000 in January 2018, for Unit 3601, a 2,582 square foot three-bedroom. The same home sold again in April 2026 for $2,350,000 — 2.1% below its 2018 price, and the highest qualified sale of the last four years.
How often do homes trade here?
64 qualified sales across four years across 395 homes, which is roughly one home in twenty-five per year. That is a healthy rate for a building this size and means comparable sales are genuinely available.
Are there large homes at Waverly South Beach?
Very few. Only three of the 395 homes exceed 2,000 square feet, and the median home is 1,127 square feet. This is a one- and two-bedroom building with a small number of exceptions.
How reliable is this analysis?
It rests on 64 qualified, arm’s-length sales drawn directly from the Miami-Dade County Property Appraiser record, with bulk transfers excluded. The four-year per-foot series is solid; the 2026 row rests on seven sales in an incomplete year and should be treated as provisional.
Sources and further reading
Interested in selling at The Waverly South Beach?
Learn more about selling your condo at The Waverly South Beach with Josh Stein.
Thinking about The Waverly South Beach?
I have sold South Florida property since 2002, more than $1 billion of it. Ask me for the recorded declaration, what has genuinely closed, or a straight answer on whether this building fits what you are after.
Josh Stein · Florida real estate sales associate, license SL3057661 · (305) 695-8257 · hello@joshsteinrealtor.comGet this building’s next recorded sale — before the listing sites catch up
- Every closed sale we can verify from the Miami-Dade record — price, date, and $/sqft when the deed supports it — not an IDX feed.
- Optional alert when a new deed posts in this building (or a short list of comps you choose).
- No spam inventory blasts. One building. One record. You decide what happens next.
Tell Josh which building. He’ll send the latest closed sales and set a quiet alert.
Get the sales recordRelated coverage
Part of Miami Luxury Condos.