

Miami Luxury Condos · South Beach · Decoplage South Beach
The transaction record is deep.
By Josh Stein · Florida license SL3057661 · Updated 30 September 2026
Verified 19 August 2026Miami-Dade County Property Appraiser1 source
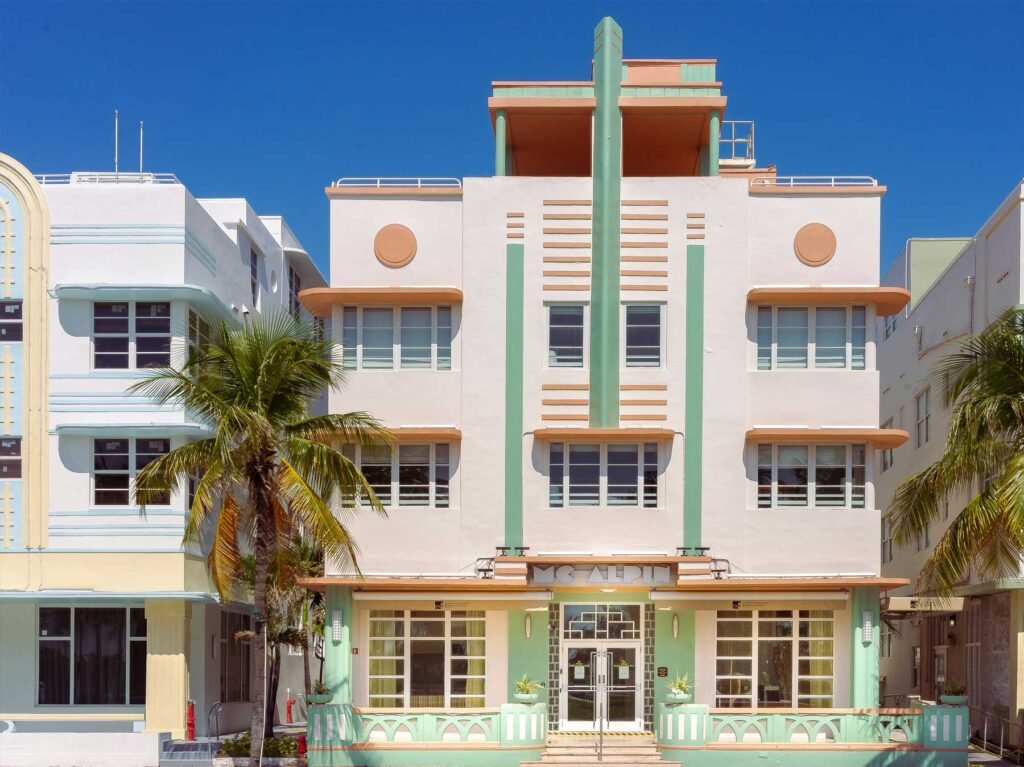
Decoplage South Beach — photography to follow
Building facts
- Address
- 100 Lincoln Rd
- Year built
- 1965
- Floors
- 16
- Residences
- 614
- Status
- Delivered — completed 1965
Key Takeaways
- Decoplage South Beach recorded 27 sales in the 12 months to 24 September 2026 — at a median of $415,000, or $682 per square foot, on the Miami-Dade County Property Appraiser record. The latest recorded sale was on 11 June 2026. Own at Decoplage South Beach? Ask Josh what yours would sell for on WhatsApp.
- The transaction record is deep — 1,941 qualified sales going back to 1990, including 1,340 resales. Only 10.7% of those resales lost money, at a median gain of 43.0%.
- It is going up — the median rose from $616 per square foot in 2023 to $725 in 2026, +17.7%, and the rise holds when I control for home size, so it is not a mix effect.
- It is a building of very small homes — 485 to 2,565 sq ft but a median of just 550. 372 of the 614 homes are studios, and 201 of them sit on two floorplates.
- Forty-two of its 657 folios are shops, not homes — the county classifies them as store condominium — the retail frontage on Lincoln Road. They are excluded from every figure here.
- The entry price mattered here too, just less — owners who bought in the 2005–08 window show a 45.5% loss rate; everyone who bought after 2008 shows 13.3% and a median gain of 30.5%.
- The four-year median is $669 per square foot — on 106 qualified sales, in a band from $422 to $1,445, at a median price of $410,000. Turnover is one home in 23 per year.
100 Lincoln Road, Miami, Florida | Neighborhood: South Beach
What is actually in the building
The county returns 657 folios at 100 Lincoln Road under the subdivision The Decoplage Condo. 614 are homes. Of the remainder, 42 are store condominium folios — the retail frontage where the building meets Lincoln Road, individually owned and individually assessed — and one is a reference folio carrying no dwelling. All 43 are excluded from every size, price and assessment figure below.
This is a building of small homes and there is no getting around it. The homes run from 485 sq ft to 2,565 sq ft, but the median is 550. The mix is 372 studios, 177 one-bedrooms, 62 two-bedrooms and three three-bedrooms — three out of every five homes here is a studio. Two floorplates alone account for 201 homes: 101 at 530 sq ft and 100 at 550. Another 51 sit at 1,190 sq ft, 36 at 565, and 26 each at 520 and 525.
That repetition is worth something concrete. In a building where 201 homes are effectively interchangeable, an exact comparable is always available, and neither a buyer nor a seller here has to argue from analogy.
For 2026 the county assesses the homes from $107,822 to $2,535,713, median $308,002. That is a spread of 23.5 times, but it reflects the size range honestly: a 485 sq ft studio and a 2,565 sq ft combined residence are not the same asset.
The price record
| Year | Qualified sales | Median price | Median $/sq ft |
|---|---|---|---|
| 2023 | 30 | $351,250 | $616 |
| 2024 | 29 | $388,000 | $705 |
| 2025 | 27 | $505,000 | $671 |
| 2026 to date | 20 | $452,500 | $725 |
Across four years that is 106 qualified sales, a median of $669 per square foot in a band from $422 to $1,445, and a median price of $410,000. The four-year change is +17.7%.
Because a rising number invites more scepticism than a falling one, I checked whether it is real or an artefact of which homes happened to sell. The median home sold moved from 550 sq ft in 2023 to 612 in 2026, so mix is a fair question. Holding size constant answers it:
| Year | Homes 485–600 sq ft | Homes over 600 sq ft |
|---|---|---|
| 2023 | $606 (n=23) | $627 (n=7) |
| 2024 | $673 (n=21) | $807 (n=8) |
| 2025 | $608 (n=12) | $713 (n=15) |
| 2026 to date | $708 (n=10) | $776 (n=10) |
Both bands are up — the studio core by 16.8% and the larger homes by 23.8%. The direction is not a mix effect. I would still treat the year-to-year path as noisy rather than smooth: 2025 dipped in both bands before 2026 recovered, and ten sales a band in an incomplete year is not a lot. My honest reading: the four-year direction is well supported and the magnitude is roughly right; the 2026 level itself should firm up before anyone treats $725 as the number.
Turnover runs at one home in 23 per year, almost exactly the median of one in 24 across the buildings in my Miami Condo Index.
One disclosure. The building’s highest recorded price, $3,150,000 on 16 March 2026, sits on a folio the county describes as units 747, 745 and 743 combined, carrying three separate common-element shares at a combined 2,565 sq ft. Its earlier sales — 1994, 1997, 2003 and 2009 — are recorded against that post-combination footprint and their price per square foot is therefore meaningless. Removing the folio entirely moves the 2026 median from $725 to $723 and the four-year median from $669 to $667, so nothing on this page turns on it; I have left it in and told you it is there.
What thirty-six years of transactions actually show
The county holds 1,941 qualified sales for this building, running from 1990 to the present. 468 of them closed in 1993 alone. Within it are 1,340 resales — cases where the record shows what an owner paid and what they later got.
| Resales | Sold at a loss | Median outcome | |
|---|---|---|---|
| All resales, 1990–2026 | 1,340 | 10.7% | +43.0% |
| Bought 2005–08 | 99 | 45.5% | +3.3% |
| Bought after 2008 | 225 | 13.3% | +30.5% |
| Sold 2021 or later | 204 | 12.7% | +47.0% |
A 10.7% loss rate over 1,340 transactions is not a small sample that could turn on a handful of deals. The median owner here sold for 43.0% more than they paid, after a median hold of 5.6 years.
The reason is partly that this building’s history starts early. A home bought in the 1993 wave had a decade of appreciation behind it before the 2005–08 peak arrived. The best outcome on the entire record is a 1,900 sq ft home bought for $45,000 on 1 January 1993 and sold for $527,500 on 1 August 1995 — up 1,072.2% in thirty-one months. That is a 1990s conversion-era number and nothing like it is available today; I include it because it is on the record, not because it is a guide.
But even here, the peak years punished the people who bought in them. Owners who came in between 2005 and 2008 show a 45.5% loss rate and a median gain of 3.3%, against 13.3% and 30.5% for everyone who bought later. The worst outcome on the record is a 545 sq ft home bought for $295,000 on 1 August 2005 and sold for $149,900 on 13 September 2011 — down 49.2%. Across every building I have measured, the same finding keeps repeating: the year an owner bought has explained more of their outcome than the building they bought in. The Decoplage is the version of that story where the building’s long history softens it rather than a version where it does not apply.
Who this building suits, and who it does not
It suits a buyer who wants a small, cheap, extremely well-comped foothold in the middle of South Beach. The four-year median is $410,000, only 10.7% of resales have lost money, per-foot prices rose 17.7% over four years, and with 201 homes on two floorplates you can establish value in an afternoon rather than a month.
It suits badly anyone who needs space. Three in five homes here are studios and the median home is 550 sq ft. If you need a second bedroom you are competing for one of 62 two-bedrooms in a 614-home building, and a third bedroom effectively does not exist — there are three.
It also suits badly a buyer who has not thought about the retail. Forty-two shop units are part of this condominium, on one of the busiest pedestrian streets in Florida. That is a fact of the building rather than a defect, but it is not a quiet residential address and no one should buy here expecting one.
If you are selling here, the record is on your side. You can show a prospective buyer a rising four-year price line, a 10.7% loss rate over 1,340 resales, and a hundred identical homes to price against. Use your own floorplate’s recent sales rather than the building median — the median is dragged around by 1,190 sq ft homes that are a different product from a 530 sq ft studio — and note that both size bands have risen, so the argument is not confined to one end of the building.
The Decoplage — Frequently Asked Questions
What have homes at Decoplage South Beach sold for in the last 12 months?
27 sales were recorded on the Miami-Dade County Property Appraiser record in the 12 months to 24 September 2026, at a median of $415,000 ($682 per square foot). The latest recorded sale was on 11 June 2026. These are recorded closings, not asking prices. If you own at Decoplage South Beach and want to know what your home would sell for, message Josh Stein on WhatsApp at (305) 695-8257.
How many homes are in The Decoplage?
The county records 657 folios at 100 Lincoln Road, of which 614 are homes, 42 are store-condominium units and one is a reference folio. The homes are 372 studios, 177 one-bedrooms, 62 two-bedrooms and three three-bedrooms.
What do homes in The Decoplage sell for?
Over the four years to August 2026 the county records 106 qualified sales at a median of $410,000, or $669 per square foot, in a band from $422 to $1,445 per foot.
Are prices in The Decoplage going up or down?
Up. The median rose from $616 per square foot in 2023 to $725 in 2026, a 17.7% gain on 106 sales. The rise survives a size control — homes under 600 sq ft are up 16.8% and larger homes 23.8% — so it is not an artefact of which homes happened to sell.
Have owners in The Decoplage made money?
Overwhelmingly yes. Across 1,340 resales only 10.7% sold at a loss, and the median owner was up 43.0% after a median hold of 5.6 years.
How big are the homes at 100 Lincoln Road?
Small. They run from 485 to 2,565 sq ft but the median is 550 sq ft, and 372 of the 614 homes are studios. Two floorplates — 530 and 550 sq ft — account for 201 homes between them.
What are the 42 non-residential folios in the building?
They are store condominium units — the individually owned retail frontage on Lincoln Road. They are part of the same condominium but are excluded from every price, size and assessment figure on this page.
What is the highest price ever paid in The Decoplage?
$3,150,000 on 16 March 2026, for a 2,565 sq ft residence the county records as units 747, 745 and 743 combined. It is the largest home in the building and carries three separate common-element shares.
Sources and further reading
Interested in selling at The Decoplage?
Learn more about selling your condo at The Decoplage in Miami Beach with Josh Stein.
Thinking about Decoplage South Beach?
I have sold South Florida property since 2002, more than $1 billion of it. Ask me for the recorded declaration, what has genuinely closed, or a straight answer on whether this building fits what you are after.
Josh Stein · Florida real estate sales associate, license SL3057661 · (305) 695-8257 · hello@joshsteinrealtor.comGet this building’s next recorded sale — before the listing sites catch up
- Every closed sale we can verify from the Miami-Dade record — price, date, and $/sqft when the deed supports it — not an IDX feed.
- Optional alert when a new deed posts in this building (or a short list of comps you choose).
- No spam inventory blasts. One building. One record. You decide what happens next.
Tell Josh which building. He’ll send the latest closed sales and set a quiet alert.
Get the sales recordRelated coverage
Part of Miami Luxury Condos.