

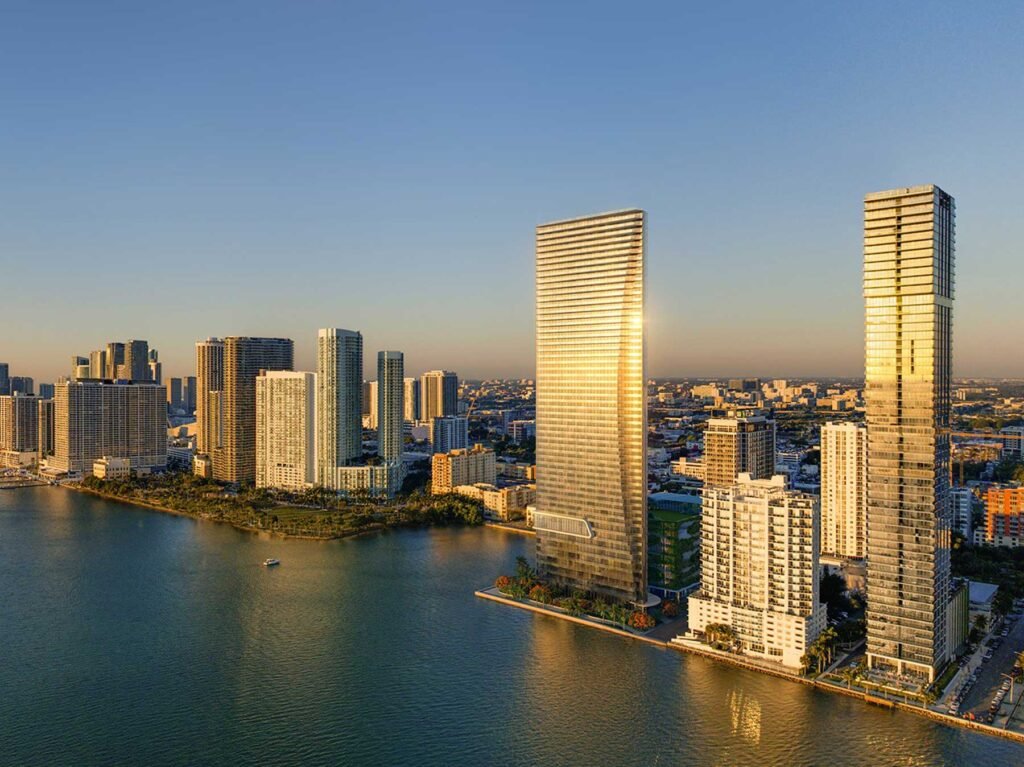
Miami Luxury Condos · Miami Beach · The Edition Residences at Miami Beach
The three highest prices ever paid here were all paid on 1 and 2 December 2014.
By Josh Stein · Florida license SL3057661 · Updated 8 October 2026Leer en español →
1 condo for sale at The Edition Residences at Miami Beach, list price $15,964.88 per sq ft.
- Asking range$80,000,000
- List price per sq ft$15,964.88
- Months of inventory12.0
- Sold, 12 months1
Listings in The Edition Residences at Miami Beach
1 listings See all in The Edition Residences at Miami Beach


Listing information is deemed reliable but is not guaranteed and is provided exclusively for consumers' personal, non-commercial use. Data is supplied by the MLS and may be subject to change or withdrawal without notice.
Last updated 1 second ago
Key facts about The Edition Residences at Miami Beach
| Address | 2901 Collins Avenue, Miami Beach FL 33140 |
|---|---|
| For sale now | 1 |
| For rent now | 1 |
| List price range | $80,000,000 |
| Size | 5,011 sq ft |
| Bedrooms | 4 BR |
| List price per sq ft | Average $15,964.88, low $15,965, high $15,965 |
| Monthly HOA | $9,361 |
| Year built | 2014 |
| Amenities | Beach Access, Beach Rights, Clubhouse, Elevators, Fitness Center, Maintenance Grounds, Pool |
| Neighborhood | Miami Beach |
Residences at The Edition Residences at Miami Beach
| Bedrooms | For sale | Size (sq ft) | List price | Avg $/sq ft | Last sale |
|---|---|---|---|---|---|
| 3 or more | 1 | 5,011 | $80,000,000 | $15,964.88 | $13,500,000 (July 27, 2026) |
Recently sold in
2 listings

Verified 22 September 2026Miami-Dade County Property Appraiser1 source
Building facts
- Address
- 2901 Collins Avenue
- Neighborhood
- Miami Beach
- Year built
- 2014
- Floors
- 18
- Residences
- 24
- Developer
- Ian Schrager
- Architect
- John Pawson
- Status
- Delivered — completed 2014
Key Takeaways
- The Edition Residences at Miami Beach recorded only two sales in the 12 months to 22 September 2026 — on the Miami-Dade County Property Appraiser record, too few for a reliable median. The latest recorded sale was on 24 July 2026. Own at The Edition Residences at Miami Beach? Ask Josh what yours would sell for on WhatsApp.
- The three highest prices ever paid here were all paid on 1 and 2 December 2014: $17,500,000, $16,500,000 and $14,000,000. The next highest, $13,500,000 in July 2026, is 77.1% of the top one; between 2015 and June 2026 no sale reached even half of it.
- Nearly half the resellers lost money: eight of 18 resales on the county record sold for less than the owner paid, a 44.4% loss rate.
- The median reseller is up 1.5% over 6.0 years: effectively flat across the better part of a decade.
- One home lost 48.1% and then made 45.2% back — unit 1403 went $2,390,000 (2014) → $1,240,000 (2020) → $1,800,000 (2022). It is still 24.7% below what its first owner paid.
- The hotel is a folio inside the same condominium — the county records a single 368,334 sq ft hotel unit here, assessed at $129,400,000 for 2026. It is not a residence and is excluded from every figure on this page.
- Five sales in four years, and none at all in 2025: against 24 homes that works out at one home in 19 a year, faster than the median of one in 23 across my Miami Condo Index (27 of the 116 other buildings are faster still), but on one of the smallest bases in it, which makes any single sale loud.
The Edition Residences at Miami Beach, by the numbers
Developer: Ian Schrager · Architect: John Pawson. Source: the building record on this site.
2901 Collins Avenue, Miami Beach, Florida 33140 | Neighborhood: Miami Beach
What is actually in the building
The county returns 26 folios at 2901 Collins Avenue. 24 are homes. Of the other two, one is a reference folio carrying no dwelling, and the other is the hotel: a single unit of 368,334 sq ft assessed at $129,400,000 for 2026, filed by the Property Appraiser inside the same condominium as the residences. Both are excluded from every figure below.
The homes run from 824 sq ft to 5,011 sq ft, median 1,984. Four are the same 2,756 sq ft plan; the rest are largely one-off sizes, which is unusual and makes building-level averages here less reliable than at a building of repeated floorplates.
I cannot give you a bedroom mix, and I am not going to guess at one. The county’s bedroom field is empty for 23 of the 24 homes. The single exception reads four bedrooms, and that is the combined folio described below. Bedroom counts are not part of what the Property Appraiser reliably records here, so they are simply absent from this page rather than filled in from a floorplan I cannot source.
One folio needs flagging before any per-foot figure is read. Units 1201 and 1202 have been combined into a single residence of 4,592 sq ft. The only sale attached to it — $6,000,000 on 16 June 2015 — predates the combination and was paid for one apartment, not two. Divided by the combined square footage it reads $1,307 per square foot, against a building that in 2015 traded between $2,104 and $2,957. No price per square foot is published for that home anywhere on this page, and it is excluded from every per-foot figure below.
For 2026 the county assesses the homes between $1,379,075 and $13,037,098, median $4,170,412.
The price record
| Year | Qualified sales | Median price | Median $/sq ft |
|---|---|---|---|
| 2023 | 1 | $5,338,000 | $2,752 |
| 2024 | 2 | $5,997,500 | $3,447 |
| 2025 | No qualified sales | ||
| 2026 to date | 2 | $9,875,000 | $2,927 |
Five qualified sales in four years cannot establish a direction, and this page will not pretend otherwise. One of the four years is empty and no year holds more than two sales. No four-year change is published and the building carries a dash in my Miami Condo Index. Anyone quoting you a percentage move at the EDITION over this period is working from something other than the county record.
What the five sales support is a level: a median of $3,445 per square foot in a band from $2,268 to $3,587, at a median price of $6,250,000.
Now the finding that matters, and it is a large one.
The three highest prices in this building’s entire history were all paid within two days in December 2014: $17,500,000 and $16,500,000 on 1 December and $14,000,000 on 2 December. A fourth sale from the same cohort, unit 1501 at $10,480,000 on 22 October 2014, resold for $13,500,000 on 24 July 2026, the fourth-highest price ever paid here. The record of $17,500,000 was paid for a 4,196 sq ft home at $4,171 per square foot, and that per-foot figure is still the building’s high-water mark twelve years later.
The highest price recorded between 2015 and 2025 is $7,450,000, in February 2021, which is 42.6% of the 2014 record, and the July 2026 sale of $13,500,000 is 77.1% of it. Some of that gap is size: the 2014 buyers took the largest homes in the building, and the largest homes have not come back to the market. But not all of it is. The best per-foot figures achieved since are $3,587 in July 2026, then $3,450 and $3,445 in 2024. The July figure is above two of the three December 2014 per-foot prices ($3,557 and $3,293), but only the record home’s $4,171 has not been matched.
Twenty of the building’s 42 recorded qualified sales fall in 2014 and 2015. That was the sell-out, and it was priced at the top of that cycle. Everything on this page follows from it.
Who has made money here, and who has not
More than half of resellers came out ahead, but by less than you would expect.
The county records 18 resales at the EDITION. Eight sold for less than the owner paid, a loss rate of 44.4%. The median reseller here is up 1.5% over a 6.0-year hold. A median of 1.5 percent over six years does not cover carrying costs and closing costs, and I would rather say so than present it as a gain.
The individual histories are worth reading, because the range is very wide.
| Home | Bought | Sold | Change |
|---|---|---|---|
| 1403 | $2,390,000 (Nov 2014) | $1,240,000 (Nov 2020) | −48.1% |
| 1204 | $3,890,000 (Feb 2015) | $3,000,000 (Aug 2021) | −22.9% |
| 1406 | $6,575,000 (Nov 2014) | $5,400,000 (Jun 2017) | −17.9% |
| 1408 | $2,040,000 (Nov 2014) | $1,960,000 (Jun 2021) | −3.9% |
| 1402 | $5,200,000 (Dec 2014) | $5,338,000 (Mar 2023) | +2.7% |
| 1409 | $2,990,000 (Nov 2014) | $3,450,000 (Mar 2022) | +15.4% |
| 1205 | $4,000,000 (Dec 2014) | $4,995,000 (May 2024) | +24.9% |
| 1001 | $5,000,000 (Apr 2018) | $6,250,000 (May 2026) | +25.0% |
Unit 1403 is the extreme case and it is instructive. Bought for $2,390,000 in November 2014 at $2,434 per square foot, it sold for $1,240,000 in November 2020 — down 48.1% — and then for $1,800,000 in April 2022, up 45.2% for the second owner. A 45.2% gain on top of a 48.1% loss does not get you back: the home is still 24.7% below its 2014 price, twelve years on.
Unit 1408 is the quieter version of the same story. $2,040,000 in November 2014, $1,977,200 in July 2015, $1,960,000 in June 2021 — three sales, each one lower than the last, a total decline of 3.9% over 6.6 years.
Against that, some owners have done well. Unit 901 sold twice inside 54 days in 2022, at $6,250,000 on 17 June and $7,200,000 on 10 August — a 15.2% gain in under two months. Units 1205, 1001 and 1501 are each up 25% to 29% over eight to twelve years (1501 bought at $10,480,000 in October 2014, sold at $13,500,000 in July 2026). Entry price explains a good part of it, but not all: the owners who bought in the 2014 and 2015 sell-out at $2,434 to $3,236 per square foot are mostly the ones sitting on losses, while the winners include units 1205 and 1001, bought at $2,759 in a small home and at $1,814 in 2018, and unit 1501, bought in the sell-out at $2,784.
Who this building suits, and who it does not
It suits a buyer who wants a serviced residence on that stretch of Collins and is buying it to live in rather than to grow. The building’s problem on the county record is not the homes; it is that the sell-out was priced at the top of the 2014 cycle, and twelve years later the market has still not returned to it. If you are indifferent to that, none of it need trouble you.
It suits a buyer negotiating from evidence. Every figure above is on the public record, and a seller here is arguing against 18 resales with a 44.4% loss rate and a median outcome of +1.5%. That is a strong position to buy from.
It suits badly anyone who needs liquidity. Five qualified sales in four years, none at all in 2025, and 24 homes in the building. If you need to exit on a timetable, this is not the building for it.
It suits badly a buyer relying on a portal valuation. One of the 24 homes is a combined residence whose only recorded sale predates the combination, and in a building this small that single folio drags every automated per-foot average well below the real level.
If you are selling here, your best evidence is recent and specific: the July 2026 sale at $13,500,000 ($3,587 per square foot) and the two 2024 sales at $3,450 and $3,445 per square foot are the three strongest per-foot figures the building has produced since the 2014 sell-out. What you should not do is anchor on late 2014. The three highest sales are twelve years old, they were mostly the largest homes in the building, and a prepared buyer will point out that only one sale since, in July 2026, has passed half of the top price.
Own at The Edition Residences at Miami Beach?
If you own here, this page already carries the county’s record of what homes in The Edition Residences at Miami Beach have sold for. Here is how to use it.
Your three options
- Sell. Price against what comparable homes in the building have actually recorded, not against asking prices.
- Rent it out. Within the condominium’s rental rules, which vary from building to building.
- Hold. Watch the record: this page is updated from the county as new sales are posted.
What I will send you
Tell me your unit. I will send you the recorded sales of comparable homes in The Edition Residences at Miami Beach, what they sold for per square foot, and a straight read on what yours could sell for today.
Two free things for owners
The Edition Residences at Miami Beach — Frequently Asked Questions
What have homes at The Edition Residences at Miami Beach sold for in the last 12 months?
Only two sales were recorded on the Miami-Dade County Property Appraiser record in the 12 months to 22 September 2026, too few to state a reliable median. The latest recorded sale was on 24 July 2026. A price for a specific home depends on its line, floor and condition. If you own at The Edition Residences at Miami Beach, message Josh Stein on WhatsApp at (305) 695-8257.
How many homes are there at the Edition Residences at Miami Beach?
Twenty-four. The county returns 26 folios at 2901 Collins Avenue: 24 residences, one reference folio, and the hotel itself, which is filed as a single 368,334 sq ft unit inside the same condominium and assessed at $129,400,000 for 2026.
How much does a home at the Edition Residences sell for?
On the five qualified sales in the four years 2023 to 2026, a median $3,445 per square foot in a band from $2,268 to $3,587, at a median price of $6,250,000. The most recent was $13,500,000 in July 2026.
Are prices at the Edition Residences rising or falling?
Five sales across four years, with one year empty, cannot establish a direction and this page does not claim one. No four-year change is published and the building carries a dash in my Miami Condo Index.
Have owners at the Edition Residences made money?
Mixed. The county records 18 resales, of which eight sold for less than the owner paid, a 44.4% loss rate, and ten sold for more. The median reseller is up 1.5% over a 6.0-year hold, which does not cover carrying and closing costs.
What is the highest price ever paid at the Edition Residences?
$17,500,000, on 1 December 2014, for a 4,196 sq ft home — $4,171 per square foot, still the building’s highest per-foot figure twelve years later. The three highest prices in the building’s history were all paid on 1 and 2 December 2014. The highest since is $13,500,000 in July 2026, and the highest between 2015 and 2025 was $7,450,000 in February 2021.
Why are the Edition Residences’ best sales so old?
Because the sell-out ran through 2014 and 2015 (20 of the building’s 42 recorded qualified sales fall in those two years) and it was priced at the top of that cycle. The market has not returned to the record level since, which is also part of why the resale loss rate here is 44.4%.
How often do homes at the Edition Residences come up for sale?
Rarely. Five qualified sales in the four years 2023 to 2026 against 24 homes, and none at all in 2025: about one home in 19 a year, faster than the median of one in 23 across my Miami Condo Index, but on one of the smallest bases in it.
Why is no price per square foot shown for one home at the Edition Residences?
Because units 1201 and 1202 have been combined into one 4,592 sq ft residence and the only sale on that folio, $6,000,000 in June 2015, predates the combination. Dividing it by the combined size gives $1,307 per square foot against a building that traded between $2,104 and $2,957 that year, so that home is excluded from every per-foot figure on this page.
Sources and further reading
Interested in selling at Edition Residences?
Learn more about selling your condo at Edition Residences with Josh Stein.
Thinking about The Edition Residences at Miami Beach?
I have sold South Florida property since 2002, more than $1 billion of it. Ask me for the recorded declaration, what has genuinely closed, or a straight answer on whether this building fits what you are after.
Josh Stein · Florida real estate sales associate, license SL3057661 · (305) 695-8257 · hello@joshsteinrealtor.comGet this building’s next recorded sale — before the listing sites catch up
- Every closed sale we can verify from the Miami-Dade record — price, date, and $/sqft when the deed supports it — not an IDX feed.
- Optional alert when a new deed posts in this building (or a short list of comps you choose).
- No spam inventory blasts. One building. One record. You decide what happens next.
Tell Josh which building. He’ll send the latest closed sales and set a quiet alert.
Get the sales recordRelated coverage
Part of Miami Luxury Condos.