

Miami Luxury Condos · Miami Beach · Fontainebleau Miami Beach
Two identical penthouses sold on the same day for $14,000,000 and $13,000,000.
By Josh Stein · Florida license SL3057661 · Updated 8 October 2026Leer en español →
12 condos for sale at Fontainebleau Miami Beach, average list price $1,505.40 per sq ft (total list price ÷ total sq ft).
- Asking range$825,000 to $2,400,000
- List price per sq ft$1,505.40
- Months of inventory16.0
- Sold, 12 months9


Listing information is deemed reliable but is not guaranteed and is provided exclusively for consumers' personal, non-commercial use. Data is supplied by the MLS and may be subject to change or withdrawal without notice.
Last updated 1 second ago
Key facts about Fontainebleau Miami Beach
| Address | 4401 Collins Avenue, Miami Beach FL 33140 |
|---|---|
| For sale now | 12 |
| For rent now | 4 |
| Pending | 1 |
| List price range | $825,000 to $2,400,000 |
| Size | 491 to 1,557 sq ft |
| Bedrooms | Studio to 2 BR |
| List price per sq ft | Average $1,505.40, low $1,125, high $2,035 |
| Monthly HOA | $606 to $2,154 |
| Year built | 2005 |
| Amenities | Billiard Room, Boat Dock, Business Center, Clubhouse, Community Kitchen, Elevators, Fitness Center, Maintenance Grounds, Parking, Playground, Pool, Putting Greens, Sauna, Spa Hot Tub, Trails |
| Neighborhood | Miami Beach |
Residences at Fontainebleau Miami Beach
| Bedrooms | For sale | Size (sq ft) | List price | Avg $/sq ft | Last sale |
|---|---|---|---|---|---|
| Studio | 4 | 491 to 526 | $825,000 to $999,000 | $1,824.91 | $790,000 (July 20, 2026) |
| 1 | 7 | 980 to 1,066 | $1,199,000 to $1,699,000 | $1,408.69 | $1,237,500 (July 15, 2026) |
| 2 | 1 | 1,557 | $2,400,000 | $1,541.43 | $990,000 (July 16, 2025) |
Unit lines
| Line | Records | Bedrooms | Size (sq ft) |
|---|---|---|---|
| 03 | 2 | 1 BR | 980 |
| 08 | 2 | Studio | 526 |
| 09 | 2 | Studio to 1 BR | 526 |
| 10 | 2 | Studio | 526 |
| 11 | 2 | 1 BR | 1,002 |
| 12 | 3 | 1 BR | 1,002 |
| 15 | 4 | 1 BR | 1,066 |
| 17 | 4 | Studio | 491 |
The last two digits of the unit number (05 in 305, 405, 505).
Recently sold in Fontainebleau Miami Beach
4 listings


Verified 23 September 2026Miami-Dade County Property Appraiser1 source
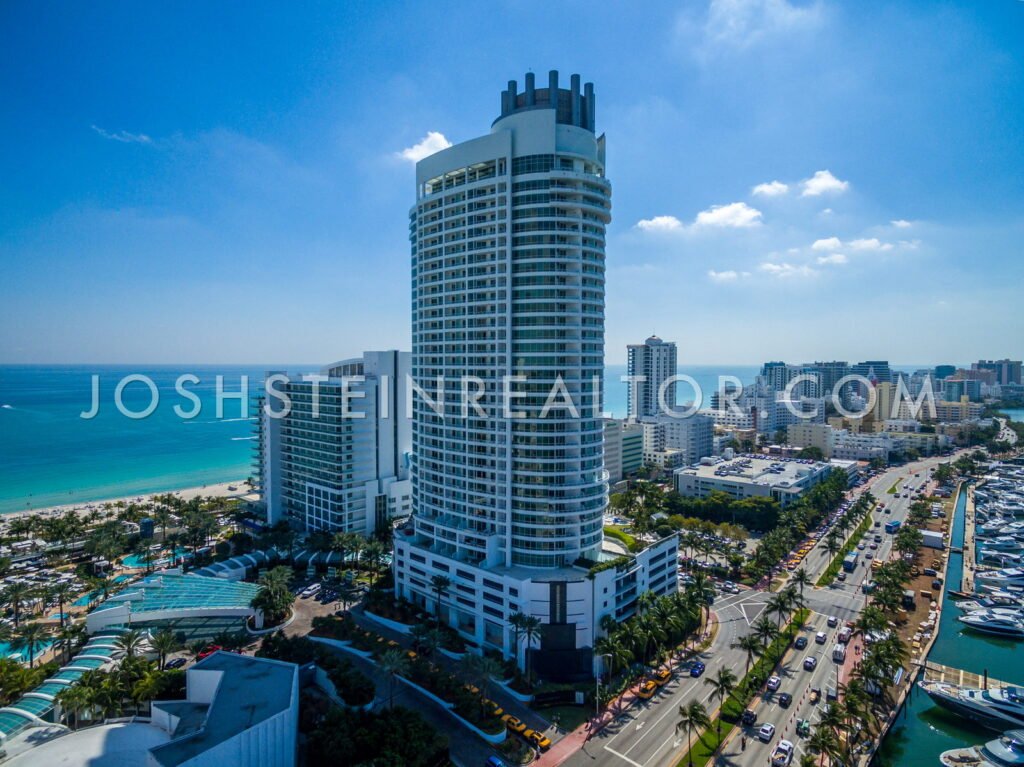
Aerial view of Fontainebleau Miami Beach in Miami Beach
Aerial view of Fontainebleau Miami Beach in Miami Beach
Key Takeaways
- Fontainebleau Miami Beach recorded 12 sales in the 12 months to 23 September 2026 — at a median of $953,000, or $1,562 per square foot, on the Miami-Dade County Property Appraiser record. The latest recorded sale was on 10 July 2026. Own at Fontainebleau Miami Beach? Ask Josh what yours would sell for on WhatsApp.
- Two identical penthouses sold on the same day for $14,000,000 and $13,000,000 — both 4,500 sq ft, both on 2 March 2023. One owner was up 261.1% and the other 12.0% — the difference is entirely the year they bought.
- This is one of the least liquid buildings I measure — turnover runs at one home in 50 per year, against a median of one in 24 across the buildings in my Miami Condo Index. Only 37 qualified sales in four years, out of 461 homes.
- The four-year change is essentially flat, at −1.2%, from $1,629 per square foot in 2023 to $1,609 in 2026. 2026 has now recorded five qualified sales, the minimum my threshold of five in both the opening and closing year requires.
- The four-year median is $1,609 per square foot — on 37 qualified sales across four years, in a band from $1,143 to $3,111.
- It is a building of small homes with two enormous exceptions — 229 studios and 230 one-bedrooms between 491 and 1,528 sq ft — and then nothing at all until the two 4,500 sq ft penthouses.
- The resale record here is mostly gains — across 365 resales 20.3% sold at a loss, at a median gain of 28.1% over a median hold of 5.4 years.
Fontainebleau Miami Beach, by the numbers
Developer: Turnberry Associates · Architect: Nichols, Brosch, Sandoval, and Associates · Lowest recorded sale in the 12 months to 23 September 2026: $790,000. Source: the building record on this site and the Miami-Dade County Property Appraiser.
4391 & 4401 Collins Avenue, Miami Beach, Florida 33140 | Neighborhood: Miami Beach
What is actually in the building
The county returns 463 folios at 4401 Collins Avenue under the subdivision Fontainebleau II Condo. 461 are homes. The other two are commercial and excluded from everything below: one store folio the county records with a square footage of minus one — plainly a defect in the roll rather than a measurement, and flagged here rather than quietly dropped — and one hotel-classified folio recorded at a single square foot.
The mix is 229 studios, 230 one-bedrooms and two four-bedrooms. That is very nearly a 50/50 split between studios and one-bedrooms, with almost nothing else. Six floorplates carry 458 of the 461 homes: 113 homes at 526 sq ft, 113 at 1,002, and 58 each at 491, 516, 980 and 1,066 sq ft. If you are pricing a purchase here, an exact comparable almost certainly exists.
The size range is where this building gets strange. The homes run from 491 sq ft to 4,500 sq ft, median 980 — a spread of more than eight to one. But that top figure belongs to exactly two homes. 459 of the 461 homes measure between 491 and 1,528 sq ft; then there is a 2,972 sq ft gap; then the two penthouses at 4,500 sq ft each. There is no middle here at all. Any average that spans that gap describes a home that does not exist in this building, and I have kept the two apart throughout.
The 2026 assessments show the same shape: $510,971 to $9,094,564, median $812,430 — a spread of 17.8 times, driven almost entirely by the two penthouses, which the county assesses at $9,094,564 each.
The price record
| Year | Qualified sales | Median price | Median $/sq ft |
|---|---|---|---|
| 2023 | 7 | $1,500,000 | $1,629 |
| 2024 | 13 | $925,000 | $1,578 |
| 2025 | 12 | $972,500 | $1,543 |
| 2026 to 23 Sept | 5 | $936,000 | $1,609 |
Across four years that is 37 qualified sales out of 461 homes, a median of $1,609 per square foot in a band from $1,143 to $3,111, and a median price of $955,000.
Four years is a short window for a building this thin, and the table above shows why. My rule is that a direction needs at least five qualified sales in both the opening and closing year. 2023 clears it with seven, and 2026 now clears it at exactly five. On those numbers the rate per foot moved from $1,629 to $1,609, a change of −1.2%, which I read as flat rather than as a direction: a five-sale median in an incomplete year, in a building where the smallest home is 491 sq ft and the largest 4,500, can move by hundreds of dollars per foot on mix alone.
Note also the 2023 median price of $1,500,000 against 2024’s $925,000. That is not a crash. Seven sales in 2023 included both penthouses at $14,000,000 and $13,000,000, which drags a seven-item median upward; per square foot the two years are within about 3% of each other. This is precisely why I lead with price per square foot rather than price.
What the record does support is that this is a very illiquid building. Turnover runs at one home in 50 per year against a median of one in 24 across the buildings in my Miami Condo Index, which is among the slowest in that index. In an average year about nine of these 461 homes change hands. That has consequences in both directions, and I set them out below.
Two identical penthouses, one day, two completely different outcomes
On 2 March 2023 both of this building’s penthouses closed. PH South sold for $14,000,000 and PH North for $13,000,000. They are the same size — 4,500 sq ft each — the county assesses them identically at $9,094,564, and they sold within a million dollars of each other on the same day. By any measure they are the same asset.
Their owners had wildly different decades.
| PH North | PH South | |
|---|---|---|
| Bought | $3,600,000 — July 2005 | $12,500,000 — April 2008 |
| Sold 2 March 2023 | $13,000,000 | $14,000,000 |
| Outcome | +261.1% | +12.0% |
Same home, same building, same exit day, and one owner made twenty-two times what the other made. Nothing about the property explains it. The entire difference is that one bought in 2005 and the other bought in 2008, near the top — and PH South’s own history shows the run it was chasing: $3,990,000 in July 2005, $6,400,000 in March 2007, then $12,500,000 in April 2008. That last buyer paid more than three times the 2005 price and then waited fifteen years to clear 12%.
I keep finding versions of this across Miami and it is the single most useful thing the county record has taught me: on the evidence, when an owner bought has mattered far more than what they bought. It is rare to see it demonstrated this cleanly, by two identical homes closing on the same afternoon.
The building’s wider resale record is mostly gains: across 365 resales, 20.3% sold at a loss, with a median gain of 28.1% over a median hold of 5.4 years. 359 of the building’s homes recorded their first qualified sale in 2005, before the worst of the peak pricing, and that early entry is a large part of why the record here reads better than at towers that sold out three years later.
Who this building suits, and who it does not
It suits a buyer who wants a small, well-comped home on the oceanfront and is not in a hurry. The floorplates repeat heavily, so you can price a purchase properly; the resale record is mostly gains; and at a four-year median of $955,000 the studios and one-bedrooms here are within reach of buyers who cannot get near an oceanfront three-bedroom.
It suits badly anyone who might need to sell quickly. One home in 50 per year is very thin. About nine of these 461 homes trade in an average year, and in 2026 so far the count is five. If your circumstances could change inside three years, that illiquidity is a real risk and it is not offset by anything in this record.
It also suits badly anyone who wants space. There is no middle in this building — you are choosing between homes under 1,528 sq ft and two penthouses that trade in eight figures. If you want a 2,000 sq ft oceanfront home, it does not exist here.
If you are selling here, the thin market is your central problem and your central advantage. With so few comparables closing each year, a buyer’s agent has very little to argue with — but equally, you may wait a long time for the right buyer, and one badly priced neighbouring sale will set the tone for a year. Price off your own floorplate, of which there are likely 57 or 112 others, and ignore the building-wide median entirely: it is pulled around by two penthouses that have nothing to do with your home.
Own at Fontainebleau Miami Beach?
If you own here, this page already carries the county’s record of what homes in Fontainebleau Miami Beach have sold for. Here is how to use it.
Your three options
- Sell. Price against what comparable homes in the building have actually recorded, not against asking prices.
- Rent it out. Within the condominium’s rental rules, which vary from building to building.
- Hold. Watch the record: this page is updated from the county as new sales are posted.
What I will send you
Tell me your unit. I will send you the recorded sales of comparable homes in Fontainebleau Miami Beach, what they sold for per square foot, and a straight read on what yours could sell for today.
Two free things for owners
Fontainebleau II — Frequently Asked Questions
What have homes at Fontainebleau Miami Beach sold for in the last 12 months?
12 sales were recorded on the Miami-Dade County Property Appraiser record in the 12 months to 23 September 2026, at a median of $953,000 ($1,562 per square foot). The latest recorded sale was on 10 July 2026. These are recorded closings, not asking prices. If you own at Fontainebleau Miami Beach and want to know what your home would sell for, message Josh Stein on WhatsApp at (305) 695-8257.
How many homes are in Fontainebleau II?
The county records 463 folios at 4401 Collins Avenue, of which 461 are homes and two are commercial. The mix is 229 studios, 230 one-bedrooms and two four-bedroom penthouses.
What do homes at 4401 Collins Avenue sell for?
Over the four years to September 2026 the county records 37 qualified sales at a median of $955,000, or $1,609 per square foot, in a band from $1,143 to $3,111 per foot.
What does the sale record show about prices here?
The median rate per foot was $1,629 in 2023, $1,578 in 2024, $1,543 in 2025 and $1,609 in 2026 to date, which is −1.2% from 2023 to 2026. The 2026 figure rests on five sales in an incomplete year, so I read the change as flat, not as a direction. This is the record of what closed, not a forecast.
How quickly do homes here sell?
Slowly. Turnover runs at about one home in 50 per year (about nine of the 461 homes in an average year), against a median of one in 24 across the buildings in my Miami Condo Index. This is among the least liquid buildings I measure.
What does the resale record show for owners here?
Across 365 resales on the county record, 20.3% sold at a loss and the median reseller was up 28.1% over a median hold of 5.4 years. A large part of the reason is that 359 homes first sold in 2005, ahead of the worst of the peak pricing.
What is the highest price ever paid at 4401 Collins Avenue?
$14,000,000, for the 4,500 sq ft PH South on 2 March 2023. PH North, the same size, sold the same day for $13,000,000.
Why did the two penthouses produce such different returns?
Because of when their owners bought. PH North was bought for $3,600,000 in July 2005 and sold for $13,000,000 — up 261.1%. PH South was bought for $12,500,000 in April 2008, near the peak, and sold for $14,000,000 — up 12.0% after fifteen years. The homes are identical; the entry prices were not.
Sources and further reading
Interested in selling at Fontainebleau?
Learn more about selling your condo at Fontainebleau with Josh Stein.
Thinking about Fontainebleau Miami Beach?
I have sold South Florida property since 2002, more than $1 billion of it. Ask me for the recorded declaration, what has genuinely closed, or a straight answer on whether this building fits what you are after.
Josh Stein · Florida real estate sales associate, license SL3057661 · (305) 695-8257 · hello@joshsteinrealtor.comGet this building’s next recorded sale — before the listing sites catch up
- Every closed sale we can verify from the Miami-Dade record — price, date, and $/sqft when the deed supports it — not an IDX feed.
- Optional alert when a new deed posts in this building (or a short list of comps you choose).
- No spam inventory blasts. One building. One record. You decide what happens next.
Tell Josh which building. He’ll send the latest closed sales and set a quiet alert.
Get the sales recordRelated coverage
Part of Miami Luxury Condos.