

Miami Luxury Condos · The Grand Condos Miami
This is the deepest record I hold for any building in Miami.
By Josh Stein · Florida license SL3057661 · Updated 29 September 2026
Verified 19 August 2026Miami-Dade County Property Appraiser1 source
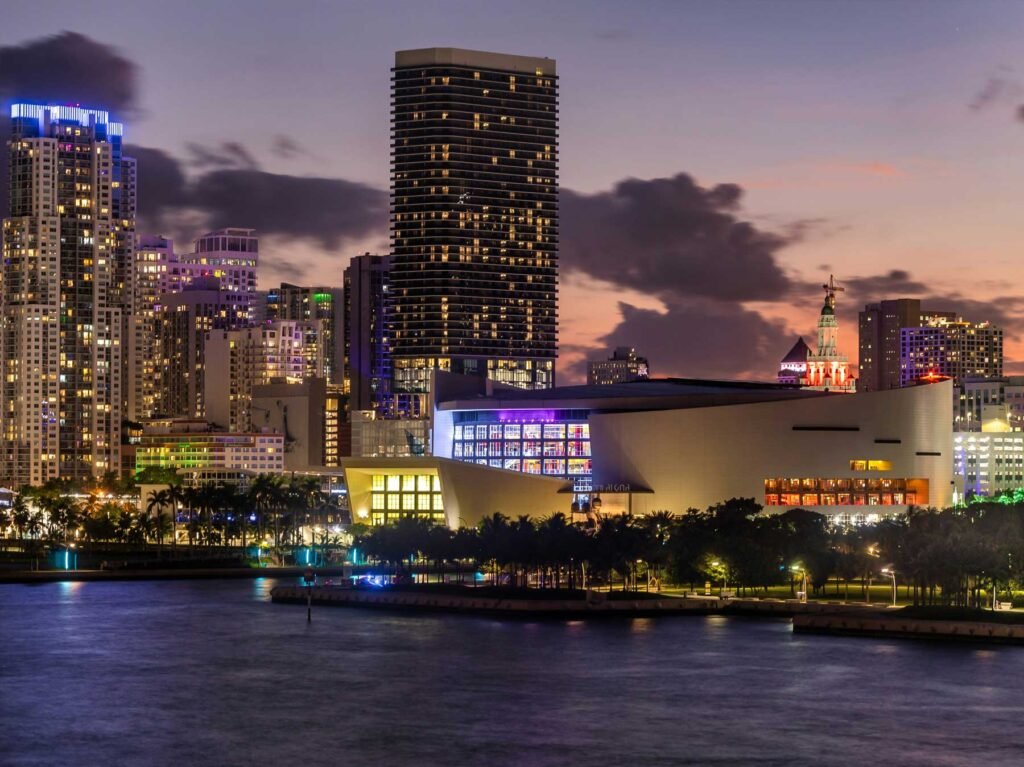
The Grand Condos Miami — photography to follow
Building facts
- Address
- 1717 N. Bayshore Drive
- Neighborhood
- Miami
- Year built
- 1986
- Residences
- 1056
- Status
- Delivered — completed 1986
Key Takeaways
- The Grand Condos Miami recorded 14 sales in the 12 months to 24 September 2026 — at a median of $575,000, or $412 per square foot, on the Miami-Dade County Property Appraiser record. The latest recorded sale was on 24 June 2026. Own at The Grand Condos Miami? Ask Josh what yours would sell for on WhatsApp.
- This is the deepest record I hold for any building in Miami — 2,727 qualified sales back to 1988, including 1,957 resales. Only 16.7% of those resales lost money, at a median gain of 30.5%.
- Only 937 of its 1,188 folios are homes — the rest are 141 store-condominium units and 110 further commercial, common-area and parking folios. This is a mixed-use complex, not a residential tower.
- Prices are up 5.8% over four years — from $429 per square foot in 2023 to $454 in 2026, on 100 qualified sales at a median price of $567,500. One of the minority of buildings in my index that is up.
- The 2004–07 buyers are the exception, exactly as everywhere else — 37.5% of them resold at a loss, against 16.2% for everyone who bought after 1992. The peak punished buyers here too, in a building that otherwise did well.
- Owners who sold recently did best of all — of the 228 resales completed since the start of 2021, just 7.5% lost money, at a median gain of 44.1%.
- Six prices on the county record are not market transactions and I have excluded them — including an $11,700 sale of a 1,390 sq ft home and a $22,750,000 print against a single 1,717 sq ft folio in 1990. All six are named on this page.
1717 N. Bayshore Drive, Miami, Florida 33132 | Neighborhood: Edgewater
What is actually in the building
The county returns 1,188 folios at 1717 N Bayshore Drive — the largest single-address record in my Miami Condo Index. 937 of them are homes. The other 251 are not, and they are not a rounding detail: 141 are store-condominium units, and a further 110 are commercial gallery, plaza, mezzanine and roof space, deeded parking, and one reference folio. This is a mixed-use complex with a shopping concourse in it, not a residential tower, and every figure below excludes all 251.
Getting that split right took work, and it is worth saying why. The county codes much of the commercial space as condominium — residential, so the ordinary filters pass it straight through. Twenty-two of those folios — the plaza units, the galleries, the mezzanines, the roof space and a valet garage — sit on the 2026 tax roll at exactly $100 each. No home in Miami-Dade is assessed at $100. Counted as homes they made this building’s assessment range read $100 to $1,464,797. Eight more commercial folios are assessed at real values, from $1,386 up to $704,168, and only the unit label gives them away. Read uncorrected, this building looks like it has 967 homes. It has 937.
The homes run from 332 sq ft to 4,487 sq ft, median 1,390. The mix is 152 studios, 284 one-bedrooms, 391 two-bedrooms, 102 three-bedrooms, six four-bedrooms, one five-bedroom and one six-bedroom. Six floorplates carry close to 300 homes: 63 at 1,066 sq ft, 61 at 1,464, 60 at 1,509, 37 at 1,602, 36 at 1,479 and 32 at 1,048.
For 2026 the county assesses the homes between $35,600 and $1,464,797, median $366,636.
The price record
| Year | Qualified sales | Median price | Median $/sq ft |
|---|---|---|---|
| 2023 | 36 | $599,500 | $429 |
| 2024 | 37 | $500,000 | $414 |
| 2025 | 18 | $434,750 | $407 |
| 2026 to date | 9 | $595,000 | $454 |
Across four years that is 100 qualified sales, a median of $416 per square foot in a band from $146 to $575, and a median price of $567,500. The four-year change is +5.8%, which puts this among the minority of buildings in my Miami Condo Index that are up over the period.
I would hold that figure loosely and I will say why. The path is not a rise — it is $429, $414, $407, then $454. Three years of drift downward and then a jump, and the jump rests on nine sales. My rule publishes a change when both the opening and closing year clear five qualified sales, and nine clears it, but nine is not many for a 937-home building. The defensible statement is that this building has traded in a $400–$460 band for four years and is currently at the top of it, not that it has appreciated 5.8%.
One sale inside that 2026 sample deserves naming rather than burying. A 1,717 sq ft home sold for $250,000 on 18 February 2026 — $145 per square foot, the floor of the entire four-year band, in a building whose median is $416. The same home sold for $550,000 in March 2021 and the county assesses it at $552,581 for 2026. I cannot tell you what that transaction was, and the record does not say, but it is not a normal open-market sale and it drags the 2026 median down rather than up. I have left it in the table because the county flagged it qualified and my method does not permit me to remove sales I merely dislike — but you should know it is there.
Turnover runs at one home in 37 per year, well below the median of one in 24 across the buildings in my Miami Condo Index. About 25 of these 937 homes trade annually. For the largest residential address I measure, that is strikingly thin.
Four decades of ownership, and the one cohort that suffered
The county holds 2,727 qualified sales for this building, the earliest dated 1988 — the deepest single-building record I have anywhere in Miami. 231 of them closed in 1990 alone, during the original sell-out. Within the record are 1,957 resales, which is more completed round trips than most buildings I measure have transactions of any kind.
| Resales | Sold at a loss | Median outcome | |
|---|---|---|---|
| All resales, 1988–2026 | 1,957 | 16.7% | +30.5% |
| Bought in the 1989–92 sell-out | 520 | 17.7% | +29.2% |
| Bought after 1992 | 1,436 | 16.2% | +30.9% |
| Bought 2004–07, at the peak | 288 | 37.5% | +11.0% |
| Sold 2021 or later | 228 | 7.5% | +44.1% |
Read the fourth row against the third and you have the most consistent finding in this whole index. In a building with a nearly forty-year record and a 16.7% overall loss rate, the buyers who came in between 2004 and 2007 lost money more than twice as often as everyone else, and the median one of them cleared 11.0% across roughly two decades. Everyone who bought after 1992 is at 16.2% and +30.9%.
I have now measured this pattern in every building I have looked at, at every price level, in every neighbourhood. The year an owner bought has predicted their outcome better than the building they bought in. The Grand is a strong building on a long record, and it did not protect its peak-year buyers.
The best documented outcome is a 1,707 sq ft home bought for $145,000 on 1 August 1990 and sold for $823,500 on 30 March 2026 — up 467.9% over almost thirty-six years. That is roughly $85 per square foot to $482, and it is the sort of return that requires outliving three cycles.
Six prices on this record are not market transactions and I have excluded them from every ownership figure above rather than let them publish. They are: $11,700 for a 1,390 sq ft home in August 2008 ($8 per square foot); $39,000 for a 1,717 sq ft home in January 2021; $50,000 for a 1,602 sq ft home in June 2006; and three 1990s prints between $60,000 and $82,806 at $47 to $56 per square foot. Separately, one folio carries a $22,750,000 sale dated November 1990 against a single 1,717 sq ft home — a bulk or portfolio transfer recorded against one folio. Left in, that $11,700 print alone generates both a fictitious 97.8% loss and a fictitious 2,165% gain, and it would have been the headline on this page.
Two caveats. 98 folios have one qualified sale or none, so those owners’ outcomes are untested. And a number of folios here combine two or three original units — their pre-combination sales are recorded at the post-combination square footage, so their historic price per foot is not meaningful and I have not used it.
Who this building suits, and who it does not
It suits a buyer who wants an inexpensive bayfront home and wants forty years of evidence behind the purchase. At a four-year median of $567,500 and $416 per square foot this is one of the cheaper waterfront addresses in the index, prices are up rather than down, and no building I measure offers anything close to 1,957 documented resales to reason from.
It suits badly anyone who needs to sell on a schedule. One home in 37 per year, in a 937-home building, means you are one of about 25 sellers competing across an enormous and varied inventory — and 2025 recorded just 18 sales in the whole complex.
It also suits badly a buyer who has not registered what they are buying into. 141 store units and a commercial concourse are part of this condominium. That is not a defect, but it is a different proposition from a residential tower and the difference should be deliberate.
If you are selling here, the building-wide median is close to useless to you and you should not use it. Homes here run from 332 to 4,487 sq ft across more than a dozen floorplates; the $416 figure describes an abstraction. Price against your own layout, of which there are likely 30 to 62 others, and against the last two years rather than the four-year change — 2024 and 2025 both closed below 2023. If a buyer quotes the $145 per square foot February sale at you, the answer is that the same home sold for $550,000 in 2021 and the county assesses it at $552,581.
The Grand — Frequently Asked Questions
What have homes at The Grand Condos Miami sold for in the last 12 months?
14 sales were recorded on the Miami-Dade County Property Appraiser record in the 12 months to 24 September 2026, at a median of $575,000 ($412 per square foot). The latest recorded sale was on 24 June 2026. These are recorded closings, not asking prices. If you own at The Grand Condos Miami and want to know what your home would sell for, message Josh Stein on WhatsApp at (305) 695-8257.
How many homes are in The Grand?
The county records 1,188 folios at 1717 N Bayshore Drive, of which 937 are homes. The other 251 are 141 store-condominium units plus commercial, common-area and parking folios. The homes are 152 studios, 284 one-bedrooms, 391 two-bedrooms, 102 three-bedrooms and nine larger.
What do homes in The Grand sell for?
Over the four years to August 2026 the county records 100 qualified sales at a median of $567,500, or $416 per square foot, in a band from $146 to $575 per foot.
Are prices in The Grand going up or down?
Up 5.8% over four years, from $429 per square foot in 2023 to $454 in 2026 — but hold that loosely. The path was $429, $414, $407, then $454, and the closing figure rests on nine sales. The safer reading is that the building has traded in a $400–$460 band for four years and is currently near the top of it.
Have owners in The Grand made money?
Most have, on an unusually long record. Across 1,957 resales going back to 1988, 16.7% sold at a loss and the median owner was up 30.5%. Owners who sold in 2021 or later show a loss rate of just 7.5% and a median gain of 44.1%.
Did buyers at the 2004–07 peak do badly here?
Yes, and they are the clear exception. 37.5% of them resold at a loss at a median gain of 11.0%, against 16.2% and +30.9% for everyone who bought after 1992 — more than twice the loss rate in the same building.
How quickly do homes in The Grand sell?
Slowly for its size. Turnover runs at about one home in 37 per year — roughly 25 of the 937 homes — against a median of one in 24 across the buildings in my Miami Condo Index.
Why does the county record show an $11,700 sale here?
Because the county flags some non-market transfers as qualified. That $11,700 price is attached to a 1,390 sq ft home in August 2008 — $8 per square foot. It is one of six such prints I have identified and excluded from the ownership figures on this page. Left in, it alone would generate both a fictitious 97.8% loss and a fictitious 2,165% gain.
Sources and further reading
Interested in selling in The Grand?
Learn more about selling your condo in The Grand with Josh Stein.
Edgewater Condo & Loft Buildings
Edgewater runs along Biscayne Bay between the Venetian Causeway and the Julia Tuttle. Every building below is covered in this series, with its own county sales record:
- 1800 Biscayne Plaza
- 1800 Club
- Aria on the Bay
- Bay House
- Biscayne Beach
- Blue Condominium
- Cite on the Bay
- City 24
- Edgewater Lofts
- Elysee Miami
- Gallery Art Condominium
- Gran Paraiso
- Icon Bay
- Moon Bay
- New Wave
- One Paraiso
- Onyx on the Bay
- Opera Tower
- Paraiso Bay
- Paramount Bay
- Platinum Condo
- Quantum on the Bay
- The Crimson
- Uptown Lofts
Thinking about The Grand Condos Miami?
I have sold South Florida property since 2002, more than $1 billion of it. Ask me for the recorded declaration, what has genuinely closed, or a straight answer on whether this building fits what you are after.
Josh Stein · Florida real estate sales associate, license SL3057661 · (305) 695-8257 · hello@joshsteinrealtor.comRelated coverage
Part of Miami Luxury Condos.
Get this building’s next recorded sale — before the listing sites catch up
- Every closed sale we can verify from the Miami-Dade record — price, date, and $/sqft when the deed supports it — not an IDX feed.
- Optional alert when a new deed posts in this building (or a short list of comps you choose).
- No spam inventory blasts. One building. One record. You decide what happens next.
Tell Josh which building. He’ll send the latest closed sales and set a quiet alert.