

Miami Luxury Condos · Edgewater · Paramount Bay
338 residential homes make up Paramount Bay.
By Josh Stein · Florida license SL3057661 · Updated 8 October 2026Leer en español →
15 condos for sale at Paramount Bay, average list price $1,171.23 per sq ft (total list price ÷ total sq ft).
- Asking range$885,000 to $5,850,000
- List price per sq ft$1,171.23
- Months of inventory7.8
- Sold, 12 months23


Listing information is deemed reliable but is not guaranteed and is provided exclusively for consumers' personal, non-commercial use. Data is supplied by the MLS and may be subject to change or withdrawal without notice.
Last updated 1 second ago
Key facts about Paramount Bay
| Address | 2020 N Bayshore Drive, Miami FL 33137 |
|---|---|
| For sale now | 15 |
| For rent now | 6 |
| Pending | 1 |
| List price range | $885,000 to $5,850,000 |
| Size | 1,135 to 4,437 sq ft |
| Bedrooms | 1 to 4 BR |
| List price per sq ft | Average $1,171.23, low $780, high $1,522 |
| Monthly HOA | $1,400 to $6,206 |
| Year built | 2010 |
| Amenities | Bike Storage, Billiard Room, Business Center, Cabana, Clubhouse, Community Kitchen, Elevators, Fitness Center, Library, Maintenance Grounds, Parking, Picnic Area, Playground, Pool, Sauna, Spa Hot Tub, Storage, Trash |
| Neighborhood | Miami |
Residences at Paramount Bay
| Bedrooms | For sale | Size (sq ft) | List price | Avg $/sq ft | Last sale |
|---|---|---|---|---|---|
| 1 | 1 | 1,135 | $885,000 | $779.74 | |
| 2 | 4 | 1,588 to 1,673 | $1,450,000 to $1,750,000 | $996.51 | $915,000 (September 8, 2026) |
| 3 or more | 10 | 1,679 to 4,437 | $1,795,000 to $5,850,000 | $1,236.17 | $1,787,000 (April 29, 2026) |
Unit lines
| Line | Records | Bedrooms | Size (sq ft) |
|---|---|---|---|
| 01 | 5 | 2 BR | 1,588 |
| 02 | 8 | 3 BR | 2,201 |
| 03 | 3 | 3 BR | 1,708 |
| 04 | 3 | 1 to 2 BR | 1,135 |
| 05 | 2 | 2 BR | 1,147 |
| 06 | 5 | 2 BR | 1,666 |
| 07 | 6 | 2 BR | 1,673 |
| 08 | 7 | 2 to 4 BR | 1,128 to 2,760 |
| 09 | 2 | 2 BR | 1,128 |
| 10 | 7 | 3 BR | 1,679 |
The last two digits of the unit number (05 in 305, 405, 505).
Recently sold in Paramount Bay
4 listings


Verified 23 September 2026Miami-Dade County Property Appraiser1 source
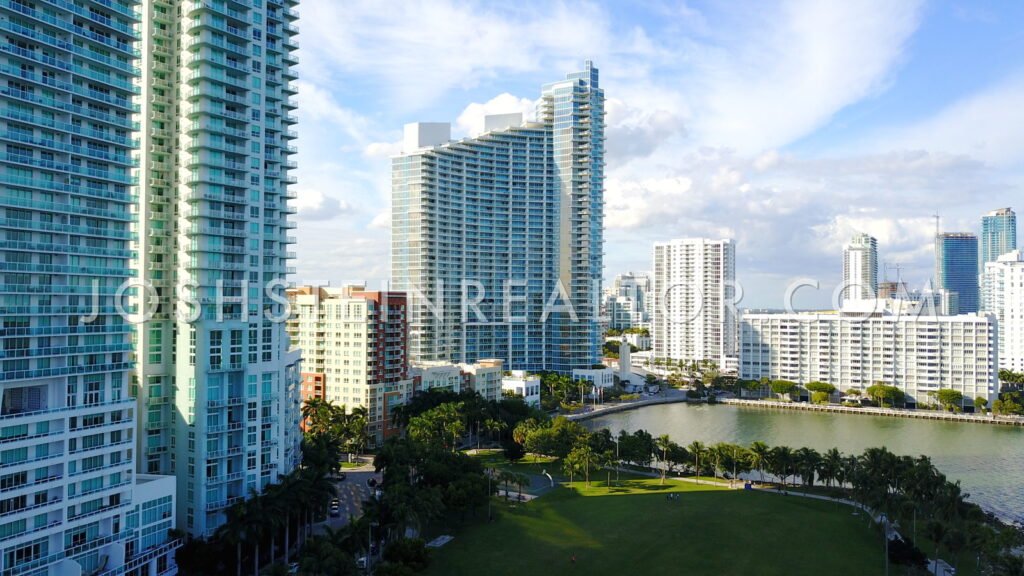
Aerial view of Paramount Bay in Edgewater
Aerial view of Paramount Bay in Edgewater
Aerial view of Paramount Bay in Edgewater
Aerial view of Paramount Bay in Edgewater
Aerial view of Paramount Bay in Edgewater
Aerial view of Paramount Bay in Edgewater
Key Takeaways
- Paramount Bay recorded 22 sales in the 12 months to 23 September 2026 — at a median of $1,440,000, or $866 per square foot, on the Miami-Dade County Property Appraiser record. The latest recorded sale was on 6 July 2026. Own at Paramount Bay? Ask Josh what yours would sell for on WhatsApp.
- 338 residential homes make up Paramount Bay — at 2020 N Bayshore Drive, from 339 county folios — one folio is not a dwelling and is excluded here.
- This building trades steadily: 70 qualified sales across four years, with double-digit volume in every single year.
- 206 of 219 documented round trips sold for more than the previous owner paid, or 94.1%, with 11 selling for less and two closing at an identical price.
- The rate per square foot dipped and recovered — rather than trending: $925, $844, $866, $900. The median price rose across the same period, which is a mix effect, not a contradiction.
- All three of the highest prices ever paid here were for the same 4,055 sq ft floorplate, in 2021, 2015 and 2012 — none of them in the last four years.
- 2026 assessed values across the 338 homes range from $250,986 to $4,074,403, median $947,392.
Paramount Bay, by the numbers
Developer: Royal Palm Communities · Architect: Arquitectonica. Source: the building record on this site.
2020 N. Bayshore Drive, Miami, Florida 33137 | Neighborhood: Edgewater
Three Hundred and Thirty-Eight Homes on North Bayshore Drive
I pulled every folio the Miami-Dade County Property Appraiser holds for Paramount Bay at 2020 N Bayshore Drive. The county returns 339 folios, of which 338 are residential dwellings and one is not. Every figure here is built on the 338.
Heated area runs from 1,128 to 4,055 square feet, median 1,666 — a large-format building with no small homes at all; the smallest floorplate in the declaration is over 1,100 square feet. The plates repeat in large blocks: 59 homes at 1,128 sq ft, 37 each at 1,588 and 2,201, and 35 at 1,708.
The bed mix is unusually even across three classes: 126 one-bedroom homes (37.3%), 102 three-bedroom (30.2%), 99 two-bedroom (29.3%), ten four-bedroom and a single five-bedroom home. A building where one-bedroom and three-bedroom homes are almost equally represented means the median price figure carries even less information here than usual.
On the 2026 tax roll, assessed values run from $250,986 to $4,074,403, median $947,392.
Year built, story count, architect and amenity detail are not in the county file, and nothing in the county analysis below depends on them.
A Dip and a Recovery, Not a Trend
| Year | Qualified sales | Median price | Median $/sq ft |
|---|---|---|---|
| 2023 | 19 | $1,340,700 | $925 |
| 2024 | 17 | $1,310,000 | $844 |
| 2025 | 19 | $1,450,000 | $866 |
| 2026 to date | 15 | $1,500,000 | $900 |
The two columns appear to disagree and it is worth resolving that before reading anything into either. Median price rises across the window — $1,340,700 to $1,500,000. Rate per square foot falls, then recovers — $925 down to $844, back up to $900. Both are true. The reconciliation is size: this building spans 1,128 to 4,055 square feet with a genuinely mixed bed distribution, so the years in which larger homes traded produced higher median prices without higher rates per foot.
The rate per foot is the measure to follow, and what it describes is a dip and a partial recovery rather than a direction. 2026 sits at $900, which is below 2023’s $925 and above the $844 low. My honest reading is that this building is roughly where it was three years ago, having been softer in between.
What makes that reading unusually reliable is the volume. 70 qualified sales closed across the four years — 19, 17, 19 and 15 — with double-digit counts in every year including the incomplete one. That consistency means none of these annual medians is being set by one or two unusual homes. Turnover works out to one home in 19 each year. The county carries 658 qualified sales at this address across its full record.
Ninety-Four Per Cent Gained, on a Nine-Year Hold
219 of the 338 homes — 64.8% — have a completed round trip on the county record, both legs qualified and arm’s-length.
Of those 219, 206 sold for more than the previous owner paid, 11 sold for less and two closed at an identical price. That is 94.1% gaining. The median gain across all 219 is 46.2%; among the 206 that gained, 49.0%. The range runs from -23.2% to +155.9%, and the median hold is 9.1 years.
A 46.2% median over a nine-year median hold is a genuinely good record, and the reason it deserves weight is the sample: 219 documented round trips is a large set, so this is not a handful of lucky sales. The 11 losses are contained too: the worst is -23.2%.
One pattern in the record is worth naming because it cuts against the recent numbers. The three highest prices ever paid here — $4,825,000 (10 September 2021), $4,525,000 (14 February 2012) and $4,300,000 (20 March 2015) — were all for the same 4,055 sq ft floorplate, and none of them falls inside the last four years. The top of this building has not traded recently. That is not evidence the top has weakened; it is evidence there is no recent comparable for it, which is a different and more useful thing for a buyer or seller of one of those homes to know.
Who Paramount Bay Suits, and Who It Does Not
It suits a buyer who wants space and wants to be able to sell. There are no small homes here — the smallest plate is 1,128 square feet — and 70 sales in four years with double-digit volume every year means a genuine market rather than an occasional one. On top of that, 94.1% of documented resales gained.
It suits a buyer who will do the work of comparing like with like. With one-bedroom, two-bedroom and three-bedroom homes almost equally represented, the building median is close to meaningless for any individual home; the four repeating plates are where the real comparables are.
It suits badly a buyer expecting a rising market. The rate per foot at $900 is still below the $925 of 2023. Three years have produced a round trip back to roughly the starting point, not growth.
It also suits badly a buyer of one of the largest homes who wants a recent benchmark — the 4,055 sq ft plate has not set a top price since 2021.
If you are selling: your band is $866 to $900 per square foot on your own plate, and the volume is on your side — this building trades and buyers can see that it does. If you own one of the largest homes, expect the absence of a recent comparable to be used against you, and be ready to argue from the plate’s own history rather than from the building’s recent median.
Own at Paramount Bay?
If you own here, this page already carries the county’s record of what homes in Paramount Bay have sold for. Here is how to use it.
Your three options
- Sell. Price against what comparable homes in the building have actually recorded, not against asking prices.
- Rent it out. Within the condominium’s rental rules, which vary from building to building.
- Hold. Watch the record: this page is updated from the county as new sales are posted.
What I will send you
Tell me your unit. I will send you the recorded sales of comparable homes in Paramount Bay, what they sold for per square foot, and a straight read on what yours could sell for today.
Two free things for owners
Paramount Bay — Frequently Asked Questions
What have homes at Paramount Bay sold for in the last 12 months?
22 sales were recorded on the Miami-Dade County Property Appraiser record in the 12 months to 23 September 2026, at a median of $1,440,000 ($866 per square foot). The latest recorded sale was on 6 July 2026. These are recorded closings, not asking prices. If you own at Paramount Bay and want to know what your home would sell for, message Josh Stein on WhatsApp at (305) 695-8257.
How many homes are in Paramount Bay?
338. The Miami-Dade County Property Appraiser records 339 folios at 2020 N Bayshore Drive, of which 338 are residential dwellings and one is not.
Are prices rising or falling at Paramount Bay?
Neither, on balance. The rate per square foot fell from $925 (2023) to $844 (2024) and has recovered to $866 and then $900 — still below where it started. Median price rose over the same period, but that reflects larger homes trading, not a higher price level.
How often do homes sell at Paramount Bay?
About one home in 19 each year, from 70 qualified sales across the last four years — 19, 17, 19 and 15. Every year in the window, including the incomplete one, has double-digit volume.
Have homes at Paramount Bay gained value?
Yes, on a large sample. 219 of the 338 homes have a documented round trip: 206 sold for more than the previous owner paid, 11 sold for less and two closed at an identical price. The median gain is 46.2% over a median hold of 9.1 years.
What is the highest price ever paid at Paramount Bay?
$4,825,000, closed 10 September 2021, for a 4,055 sq ft home at $1,190 per square foot. The three highest prices on record were all that same floorplate, in 2021, 2015 and 2012 — none within the last four years.
What size are the homes at Paramount Bay?
1,128 to 4,055 square feet, median 1,666, with no small homes in the declaration. The mix is 126 one-bedroom, 102 three-bedroom, 99 two-bedroom, ten four-bedroom and one five-bedroom.
Why does the median price rise while the rate per square foot falls?
Because the building spans 1,128 to 4,055 square feet with one-, two- and three-bedroom homes almost equally represented. In years when larger homes traded, the median price rose without the underlying rate per foot rising. The rate per foot is the measure to follow.
Sources and further reading
Interested in selling at Paramount Bay?
Learn more about selling your condo at Paramount Bay with Josh Stein.
Edgewater Condo & Loft Buildings
Edgewater runs along Biscayne Bay between the Venetian Causeway and the Julia Tuttle. Every building below is covered in this series, with its own county sales record:
- 1800 Biscayne Plaza
- 1800 Club
- Aria on the Bay
- Bay House
- Biscayne Beach
- Blue Condominium
- Cite on the Bay
- City 24
- Edgewater Lofts
- Elysee Miami
- Gallery Art Condominium
- Gran Paraiso
- Icon Bay
- Moon Bay
- New Wave
- One Paraiso
- Onyx on the Bay
- Opera Tower
- Paraiso Bay
- Platinum Condo
- Quantum on the Bay
- The Crimson
- The Grand Condos Miami
- Uptown Lofts
Thinking about Paramount Bay?
I have sold South Florida property since 2002, more than $1 billion of it. Ask me for the recorded declaration, what has genuinely closed, or a straight answer on whether this building fits what you are after.
Josh Stein · Florida real estate sales associate, license SL3057661 · (305) 695-8257 · hello@joshsteinrealtor.comGet this building’s next recorded sale — before the listing sites catch up
- Every closed sale we can verify from the Miami-Dade record — price, date, and $/sqft when the deed supports it — not an IDX feed.
- Optional alert when a new deed posts in this building (or a short list of comps you choose).
- No spam inventory blasts. One building. One record. You decide what happens next.
Tell Josh which building. He’ll send the latest closed sales and set a quiet alert.
Get the sales recordRelated coverage
Part of Miami Luxury Condos.