

Miami Luxury Condos · Edgewater · Quantum on the Bay
692 homes across two towers.
By Josh Stein · Florida license SL3057661 · Updated 30 September 2026
Verified 18 August 2026Miami-Dade County Property Appraiser1 source
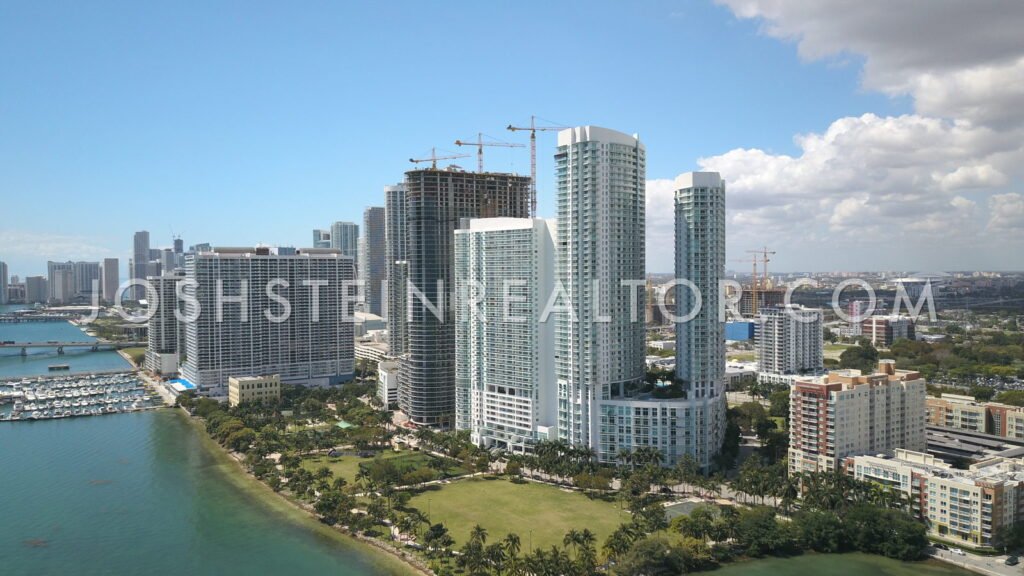
Aerial view of Quantum on the Bay in Edgewater
Key Takeaways
- Quantum on the Bay recorded 27 sales in the 12 months to 23 September 2026 — at a median of $422,500, or $508 per square foot, on the Miami-Dade County Property Appraiser record. The latest recorded sale was on 23 June 2026. Own at Quantum on the Bay? Ask Josh what yours would sell for on WhatsApp.
- 692 homes across two towers — 453 in the South building and 239 in the North — the county records them as separate condominiums.
- It trades on real volume — 117 qualified sales in four years, about one home in twenty-one per year in the South tower.
- Both towers are declining, and at a similar rate — the South is down 7.9% per square foot since 2023, the North 9.1%.
- That decline is trustworthy precisely because the volume is high — this is not a trend drawn from three transactions.
- The building record was set this year — $1,342,000 in March 2026, for the largest home in the South tower.
- The North tower is the larger-format building — a median of 1,084 square feet against 838 in the South.
Quantum on the Bay, by the numbers
Developer: Terra Group · Architect: Nichols, Brosch, Sandoval and Associates. Source: the building record on this site.
1900 N. Bayshore Drive, Miami, Florida 33137 | Neighborhood: Edgewater
Two towers, one address, separate records
Counted against the Miami-Dade County Property Appraiser record on 18 August 2026, Quantum on the Bay returns 700 distinct folios at 1900 North Bayshore Drive. Filtered to residential homes and grouped by subdivision, that is 453 homes in the South tower and 239 in the North — 692 in total.
The county records the two as separate condominiums, and this page reports them separately for that reason. The remaining eight folios are commercial: seven retail units and one common area, none of them homes.
| South tower | North tower | |
|---|---|---|
| Residential homes | 453 | 239 |
| Median size | 838 sq ft | 1,084 sq ft |
| Size range | 594–1,970 sq ft | 637–2,011 sq ft |
| Median 2026 assessed value | $353,489 | $396,122 |
| Highest 2026 assessed value | $766,913 | $850,563 |
| Qualified sales, 2023–2026 | 86 | 31 |
The South tower is the larger and more compact of the two: nearly twice the homes, at a median 246 square feet smaller. Its bedroom mix is 250 one-bedrooms, 156 two-bedrooms, 35 studios and 12 three-bedrooms. The North tower runs to 101 two-bedrooms, 97 one-bedrooms, 32 three-bedrooms, eight studios and a single four-bedroom — a more balanced building with a meaningful supply of larger homes.
High sales volume, ordinary turnover
The reason this page can say more than most is volume. 117 qualified, arm’s-length sales across the two towers since the start of 2023.
In the South tower that is 86 sales in a 453-home building — about one home in twenty-one trading every year. The North tower is slower at roughly one in thirty-one.
What that buys a buyer or a seller is certainty. Here there is nearly always current inventory, nearly always a recent comparable in your own tower, and an exit is a transaction rather than a project.
What high volume lets us say about price
Qualified sales from the county record, by tower.
| Year | South tower | North tower | ||
|---|---|---|---|---|
| Sales | $/sq ft | Sales | $/sq ft | |
| 2023 | 31 | $547 | 10 | $571 |
| 2024 | 22 | $552 | 11 | $589 |
| 2025 | 20 | $526 | 8 | $563 |
| 2026 to date | 13 | $504 | 2 | $519 |
Both towers are down, and by similar amounts: the South is off 7.9% per square foot since 2023, the North 9.1%. Both peaked in 2024 and have fallen in each year since.
The important point is not the size of the decline — it is modest by the standards of this market — but the confidence with which it can be stated. The South tower’s figures rest on 86 transactions. That is a large enough sample that the direction is not an artefact of which homes happened to sell, and it is corroborated by an independent second building on the same site moving the same way.
The North tower’s 2026 figure deserves a caveat of its own: it rests on two sales. Taken alone that would prove nothing. It carries some weight here only because the South tower — 13 sales in the same period, same address, same market — points the same direction.
One genuine curiosity sits against the trend. The building’s highest qualified sale on record, $1,342,000, was recorded in March 2026 — the middle of its weakest year — for the 1,970 square foot home that is the largest in the South tower. At $681 per square foot it sold well above the 2026 median of $504. Large homes here remain scarce, and scarcity is holding up their pricing while the standard stock softens.
Who each tower suits
The South tower suits a buyer who wants liquidity above all. It is compact, with a median of 838 square feet and mostly one-bedrooms, and at about one home in twenty-one a year a recent comparable is rarely far away.
The North tower suits a buyer who wants more space at the same address. A median of 1,084 square feet, 32 three-bedrooms and a four-bedroom give it a genuine upper tier the South tower lacks. You give up some liquidity for it.
For an investor, the record is clear in both directions. Per-foot values have fallen about 8% over four years on strong evidence, and the sales volume means current comparables are available in both towers.
If you are selling in either tower, the comparables are plentiful and public, and a buyer’s agent will find them as easily as you will. Price against the current per-foot figure for your own tower. The one genuine exception is a large home: on the March 2026 evidence, the biggest residences here are still commanding a substantial premium to the building median.
Quantum on the Bay — Frequently Asked Questions
What have homes at Quantum on the Bay sold for in the last 12 months?
27 sales were recorded on the Miami-Dade County Property Appraiser record in the 12 months to 23 September 2026, at a median of $422,500 ($508 per square foot). The latest recorded sale was on 23 June 2026. These are recorded closings, not asking prices. If you own at Quantum on the Bay and want to know what your home would sell for, message Josh Stein on WhatsApp at (305) 695-8257.
How many units are in Quantum on the Bay?
The Miami-Dade County Property Appraiser records 700 distinct folios at 1900 North Bayshore Drive, of which 692 are residential homes: 453 in the South tower and 239 in the North. The county treats the two towers as separate condominiums. The remaining eight folios are seven retail units and one common area.
What is the difference between the two Quantum towers?
Size. The South tower is larger in unit count but more compact per home, with a median of 838 square feet and a mix dominated by one-bedrooms. The North tower has a median of 1,084 square feet, 32 three-bedrooms and one four-bedroom, giving it an upper tier the South tower does not have.
Is Quantum on the Bay easy to buy and sell in?
There have been 117 qualified sales across the two towers since the start of 2023 — about one home in twenty-one per year in the South tower and roughly one in thirty-one in the North.
Are prices falling at Quantum on the Bay?
Yes, modestly. Median price per square foot in the South tower has gone $547, $552, $526, $504 across the four years, a fall of 7.9%. The North tower has moved $571, $589, $563, $519, a fall of 9.1%. Both peaked in 2024 and have declined in each year since.
How much can that decline be trusted?
The South tower’s trend rests on 86 qualified transactions, which is large enough that it cannot be explained by which homes happened to sell, and the North tower moves the same way independently. The North’s own 2026 figure rests on just two sales and should not be read alone.
What is the most expensive sale at Quantum on the Bay?
$1,342,000, recorded in March 2026 for the 1,970 square foot residence that is the largest home in the South tower. At $681 per square foot it sold well above that year’s median of $504, which suggests the scarcity of large homes here is supporting their pricing even as the standard stock softens.
What does the sale record show about Quantum on the Bay’s prices?
A modest, well-evidenced decline. Median price per square foot is down 7.9% in the South tower and 9.1% in the North since 2023, on 117 qualified sales, and both towers have fallen in each year since their 2024 peak.
Sources and further reading
Interested in selling in Quantum on the Bay?
Learn more about selling your condo in Quantum on the Bay with Josh Stein.
Edgewater Condo & Loft Buildings
Edgewater runs along Biscayne Bay between the Venetian Causeway and the Julia Tuttle. Every building below is covered in this series, with its own county sales record:
- 1800 Biscayne Plaza
- 1800 Club
- Aria on the Bay
- Bay House
- Biscayne Beach
- Blue Condominium
- Cite on the Bay
- City 24
- Edgewater Lofts
- Elysee Miami
- Gallery Art Condominium
- Gran Paraiso
- Icon Bay
- Moon Bay
- New Wave
- One Paraiso
- Onyx on the Bay
- Opera Tower
- Paraiso Bay
- Paramount Bay
- Platinum Condo
- The Crimson
- The Grand Condos Miami
- Uptown Lofts
Thinking about Quantum on the Bay?
I have sold South Florida property since 2002, more than $1 billion of it. Ask me for the recorded declaration, what has genuinely closed, or a straight answer on whether this building fits what you are after.
Josh Stein · Florida real estate sales associate, license SL3057661 · (305) 695-8257 · hello@joshsteinrealtor.comGet this building’s next recorded sale — before the listing sites catch up
- Every closed sale we can verify from the Miami-Dade record — price, date, and $/sqft when the deed supports it — not an IDX feed.
- Optional alert when a new deed posts in this building (or a short list of comps you choose).
- No spam inventory blasts. One building. One record. You decide what happens next.
Tell Josh which building. He’ll send the latest closed sales and set a quiet alert.
Get the sales recordRelated coverage
Part of Miami Luxury Condos.