

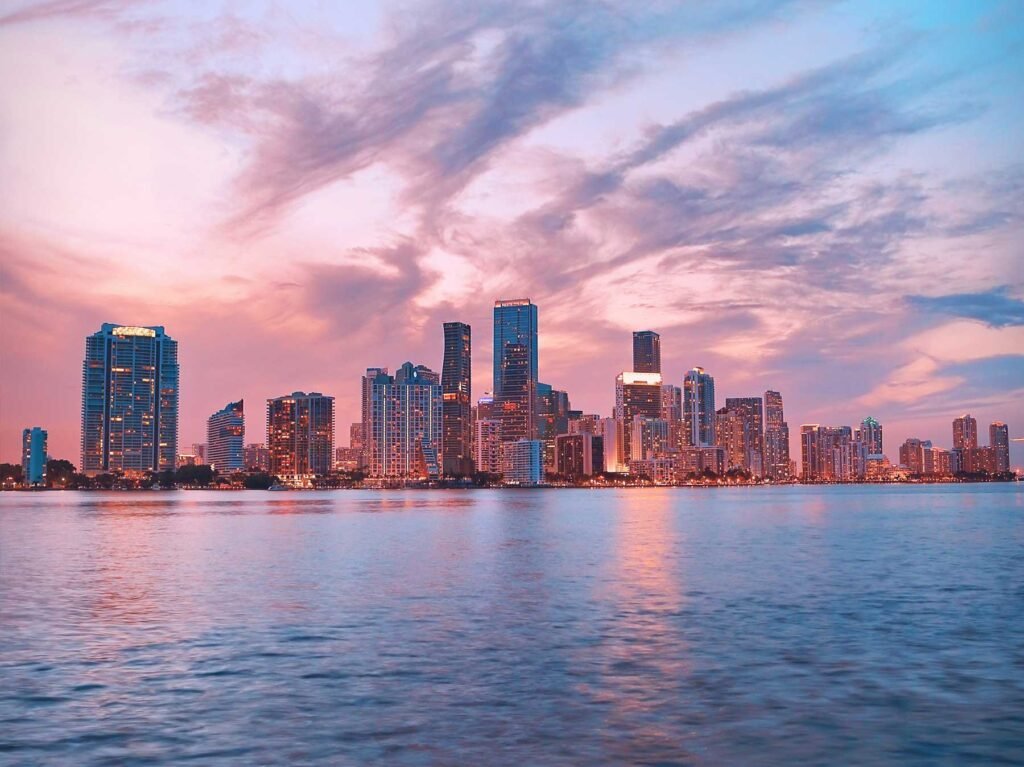
Miami Luxury Condos · Brickell · Axis on Brickell
This is two separate condominiums.
By Josh Stein · Florida license SL3057661 · Updated 12 October 2026Leer en español →
4 condos for sale at Axis on Brickell, average list price $537.60 per sq ft (total list price ÷ total sq ft).
- Asking range$430,000 to $650,000
- List price per sq ft$537.60
- Months of inventory24.0
- Sold, 12 months2


Listing information is deemed reliable but is not guaranteed and is provided exclusively for consumers' personal, non-commercial use. Data is supplied by the MLS and may be subject to change or withdrawal without notice.
Last updated 1 second ago
Key facts about Axis on Brickell
| Address | 1111 SW 1st Avenue, Miami FL 33130 |
|---|---|
| For sale now | 4 |
| For rent now | 6 |
| List price range | $430,000 to $650,000 |
| Size | 705 to 1,099 sq ft |
| Bedrooms | 1 to 2 BR |
| List price per sq ft | Average $537.60, low $474, high $610 |
| Monthly HOA | $825 to $1,304 |
| Year built | 2008 |
| Amenities | Bike Storage, Billiard Room, Business Center, Cabana, Clubhouse, Dog Park, Elevators, Fitness Center, Maintenance Grounds, Management, Parking, Picnic Area, Playground, Pool, Recreation Facilities, Sauna, Spa Hot Tub, Storage, Trash |
| Neighborhood | Miami |
Residences at Axis on Brickell
| Bedrooms | For sale | Size (sq ft) | List price | Avg $/sq ft | Last sale |
|---|---|---|---|---|---|
| 1 | 1 | 705 | $430,000 | $609.93 | $405,000 (March 2, 2026) |
| 2 | 3 | 1,013 to 1,099 | $480,000 to $650,000 | $521.28 | $500,000 (February 19, 2026) |
Recently sold in
4 listings


Verified 23 September 2026Miami-Dade County Property Appraiser1 source
Key Takeaways
- Axis on Brickell recorded 24 sales in the 12 months to 23 September 2026 — at a median of $566,500, or $567 per square foot, on the Miami-Dade County Property Appraiser record. The latest recorded sale was on 13 July 2026. Own at Axis on Brickell? Ask Josh what yours would sell for on WhatsApp.
- This is two separate condominiums — the south tower at 79 SW 12th Street (352 homes) and the north at 1111 SW 1st Avenue (366) — 718 homes filed under two declarations.
- The two towers are near-identical, and the record proves it — the same median home of 1,024 square feet, four-year medians of $587 and $588 per square foot, and four-year changes of −7.3% and −7.0%.
- It took five years to sell — the largest single year was 2012, four years after the first sales — 159 homes in the north and 116 in the south.
- Selling after 2021 changed everything — the loss rate falls from 29.5% to 8.1% in the north and from 26.8% to 3.1% in the south.
- Both towers are down over four years — and 2026 is the weakest year in the record for both, at $542 and $543 per square foot.
- A $3,300,000 deed in the record is not a sale — $2,984 per square foot against a band that tops out at $777. It is excluded from every figure on this page and explained below.
Axis on Brickell, by the numbers
Developer: BCRE Brickell LLC · Architect: Arquitectonica · 718 homes in two condominiums, 352 + 366 (Miami-Dade County Property Appraiser, year built 2008).
1111 SW 1st Avenue, Miami, Florida 33130 | Neighborhood: Brickell
What is actually here — two condominiums
Axis on Brickell is two towers, and the county holds them as two entirely separate condominiums with two separate declarations. Check which tower a listing refers to.
| South tower | North tower | |
|---|---|---|
| County address | 79 SW 12th Street | 1111 SW 1st Avenue |
| Folios / homes | 353 / 352 | 368 / 366 |
| Shares close at | 99.7033% | 100.4596% |
| Size range | 693–1,813 sq ft | 693–1,930 sq ft |
| Median size | 1,024 sq ft | 1,024 sq ft |
| 2026 assessed median | $432,470 | $392,586 |
Seven hundred and eighteen homes across the two. Each declaration’s common-element shares close within half a percent of 100% once a single county decimal-point error is normalised in each — the roll carries one misplaced decimal per tower, which the record itself makes obvious because the share per square foot is otherwise near constant. Both pulls are whole.
The composition is close to identical. The south tower is 234 two-bedrooms, 112 one-bedrooms and six three-bedrooms. The north is 241 two-bedrooms, 116 one-bedrooms, eight three-bedrooms and one studio. Both are overwhelmingly two-bedroom buildings, which is the single most useful thing to know about them.
Six floorplates cover 262 of the south tower’s 352 homes and 234 of the north tower’s 366, and several of those plates — 1,106, 1,108, 707, 693 — appear in both buildings. Only 14 homes in the whole complex are three-bedrooms.
The 2026 assessed values run $170,600 to $905,883 in the south (median $432,470) and $195,855 to $1,084,560 in the north (median $392,586).
The price record, tower by tower
Qualified, arm’s-length sales from the county record, retrieved 22 August 2026. South tower — 79 SW 12th Street:
| Year | Qualified sales | Median price | Median $/sq ft |
|---|---|---|---|
| 2023 | 20 | $586,000 | $584 |
| 2024 | 15 | $620,000 | $617 |
| 2025 | 14 | $590,000 | $597 |
| 2026 to 22 Aug | 7 | $575,000 | $542 |
North tower — 1111 SW 1st Avenue:
| Year | Qualified sales | Median price | Median $/sq ft |
|---|---|---|---|
| 2023 | 18 | $595,000 | $584 |
| 2024 | 15 | $600,000 | $599 |
| 2025 | 11 | $620,000 | $583 |
| 2026 to 22 Aug | 5 | $500,000 | $543 |
Both towers rose through 2024, held in 2025 and are weaker in 2026 — down 7.3% and 7.0% per square foot respectively across the four years. The four-year bands are $441 to $686 in the south (median $587) and $479 to $777 in the north (median $588). Fifty-six qualified sales in the south and 49 in the north, across four years, works out at about one home in twenty-five and one in thirty each year.
With eleven to twenty sales a year per tower, I would treat the 2026 softness as a direction and not a magnitude. Seven sales and five sales are small samples, and the drop to $542 and $543 is consistent both with a genuine repricing and with which apartments happened to sell.
Now the disclosure, because it is the largest number in the record and it is not real. The county holds a $3,300,000 deed dated 14 February 2018 on unit 2617-N, a 1,106 square foot home in the north tower — $2,984 per square foot, in a building whose four-year band tops out at $777 and whose highest genuine sale is less than half that total. The county flags it as qualified. The same folio carries a second deed on the same day for $365,000, which is consistent with the $362,900 that home sold for in July 2012 and with everything else in the building. I have excluded the $3,300,000 from every figure on this page and I am telling you it exists because a buyer’s agent pulling the same record will find it and may not look at the second deed.
The real records are $1,400,000 in the north tower (unit 3719-N, 1,801 square feet, 5 November 2025, $777 per square foot) and $1,075,000 in the south (unit 3506-S, 1,813 square feet, 27 January 2022, $593 per square foot).
Two towers that really are the same building
Where some twin-tower developments have two different price histories, at Axis the two towers genuinely behave alike — and it is worth showing, because it means a comparable from one tower is a fair comparable for the other.
| South tower | North tower | |
|---|---|---|
| Median home | 1,024 sq ft | 1,024 sq ft |
| Four-year median $/sq ft | $587 | $588 |
| Four-year change | −7.3% | −7.0% |
| Completed round trips | 224 of 352 | 199 of 366 |
| Median outcome | +26.6% | +25.9% |
| Median hold | 9.9 years | 9.5 years |
| Sold at a loss | 30 — 13.4% | 35 — 17.6% |
The complex also did not sell out at delivery, and that is the fact most worth knowing. The first qualified sales were in 2008 — 90 in the south at a median of $360,370 and $368 per square foot, 81 in the north at $354,900 and $380. Then the market stopped. Sixty-seven more sold in the south in 2011 at $245,900 and $318 per square foot, and 57 in the north at $257,900 and $303. The largest single year in either tower was 2012, four years after the first sales — 116 homes in the south and 159 in the north, at $324 and $318 per square foot.
So this building has three distinct entry cohorts, and the 2011 entrants paid 14% to 20% less per square foot than the 2008 buyers ($318 against $368 in the south, $303 against $380 in the north). That is the opposite of a clean sell-out and it means the resale record here is not one experiment but three.
Across all of them, the exit year dominates. In the south tower, 26 of the 97 owners who sold before 2021 lost money — 26.8%, at a median of +12.9%. Of the 127 who sold in 2021 or later, four lost — 3.1%, at a median of +47.5%. In the north the same split runs 29.5% before 2021 against 8.1% after, with the median rising from +10.6% to +54.0%.
- The best clean result: a 1,801 square foot home bought for $496,843 in June 2012 and sold for $1,400,000 in November 2025 — up 181.8% over 13.4 years.
- A 1,108 square foot home bought for $305,710 in June 2012 sold for $685,000 in March 2024 — up 124.1%.
- The worst is a 694 square foot home bought for $272,900 in June 2008 and sold for $150,000 in April 2010 — down 45.0% in under two years.
These are gross figures, before commissions, taxes, assessments and carrying costs over a decade. And the county record shows transactions and not reasons, so none of this establishes why the towers behaved as they did — only that they behaved almost identically.
Who this building suits, and who it suits badly
It suits a two-bedroom buyer, and almost nobody else. Four hundred and seventy-five of the 718 homes are two-bedrooms. If that is what you want, you have 475 two-bedroom homes and roughly a hundred sales of all sizes in the last four years to price against.
It suits a three-bedroom buyer very badly. There are fourteen three-bedroom homes in the entire complex — six in the south tower and eight in the north. At one home in twenty-five trading each year, you could wait a very long time.
It suits a buyer who wants comparables they can trust. The two towers trade within a dollar of each other per square foot and share several floorplates, so the effective comparable pool is 718 homes rather than 350. That is a real advantage when it comes to pricing.
It does not support an appreciation case right now. Both towers are down over four years and 2026 is the weakest year in the record for both. What the long record supports is that the 2011 and 2012 entrants have done well and the 2008 entrants have not — which is a statement about when they bought, not about the building.
And if you are selling here: your comparable set spans both towers whether you like it or not, so a weak sale at the other address will be used against you. Two things to have ready: the 2026 medians of $542 and $543 per square foot are the lowest four-year readings in the record, and the $3,300,000 deed on unit 2617-N will surface in any thorough record pull. Know what it is before someone else explains it to you.
Own at Axis on Brickell?
If you own here, this page already carries the county’s record of what homes in Axis on Brickell have sold for. Here is how to use it.
Your three options
- Sell. Price against what comparable homes in the building have actually recorded, not against asking prices.
- Rent it out. Within the condominium’s rental rules, which vary from building to building.
- Hold. Watch the record: this page is updated from the county as new sales are posted.
What I will send you
Tell me your unit. I will send you the recorded sales of comparable homes in Axis on Brickell, what they sold for per square foot, and a straight read on what yours could sell for today.
Two free things for owners
How this building compares: the Miami Condo Index ranks buildings by price per square foot and four-year change from the county record, the Miami Resale Record shows how often resales closed below the seller’s price, and the 100 Latest Sales list shows MLS closings as they post. Every building we cover is on the Miami Luxury Condos page.
Axis on Brickell — Frequently Asked Questions
What have homes at Axis on Brickell sold for in the last 12 months?
24 sales were recorded on the Miami-Dade County Property Appraiser record in the 12 months to 23 September 2026, at a median of $566,500 ($567 per square foot). The latest recorded sale was on 13 July 2026. These are recorded closings, not asking prices. If you own at Axis on Brickell and want to know what your home would sell for, message Josh Stein on WhatsApp at (305) 695-8257.
Is Axis on Brickell one building or two?
Two, and the county holds them as two separate condominiums with separate declarations. The south tower is at 79 SW 12th Street with 352 homes; the north tower is at 1111 SW 1st Avenue with 366. Unusually, the two behave almost identically on the price record, so a comparable from one is a fair comparable for the other.
How many condos are there in total?
Seven hundred and eighteen. The county holds 353 folios at 79 SW 12th Street and 368 at 1111 SW 1st Avenue. Each declaration closes within half a percent of 100% once a single county decimal-point error is normalised, which confirms nothing is missing from either count.
What size are the residences?
Both towers have a median home of 1,024 square feet. The south runs 693 to 1,813 square feet and the north 693 to 1,930. The complex is overwhelmingly two-bedroom — 475 of the 718 homes — with 228 one-bedrooms, just 14 three-bedrooms and one studio.
What do homes sell for at Axis on Brickell?
Across 2023 to 2026 the south tower’s qualified sales fall in a band of $441 to $686 per square foot with a median of $587, and the north tower’s in a band of $479 to $777 with a median of $588. The two towers price within a dollar of each other.
Is there really a $3,300,000 sale in this building?
There is a deed for that amount dated 14 February 2018 on unit 2617-N, a 1,106 square foot home, and the county flags it as qualified — but it works out at $2,984 per square foot in a building whose four-year band tops out at $777. The same folio carries a second deed on the same day for $365,000, consistent with the $362,900 that home sold for in 2012. I have excluded the $3,300,000 from every figure on this page. The genuine records are $1,400,000 in the north tower and $1,075,000 in the south.
When did Axis on Brickell sell out?
It took five years and it never really sold out at delivery. The first qualified sales were in 2008 — 90 in the south and 81 in the north, around $368 to $380 per square foot. The largest single year was 2012, four years later: 116 homes in the south and 159 in the north, at $324 and $318 per square foot. There are three distinct entry cohorts here, not one.
Have owners here made money?
Most have, and the exit year decides it. In the south tower, 26.8% of the 97 owners who sold before 2021 lost money against 3.1% of the 127 who sold afterwards, with the median rising from +12.9% to +47.5%. In the north, 29.5% before 2021 against 8.1% after. Across all completed round trips the medians are +26.6% and +25.9% over holds of about ten years, gross of commissions, taxes, assessments and carrying costs.
Are prices at Axis going up or down?
Down over four years — 7.3% in the south and 7.0% in the north per square foot — with 2026 the weakest year in the record for both towers. With seven and five sales respectively in 2026 so far, I would treat that as a direction rather than a measured magnitude.
Sources and further reading
Interested in selling at Axis on Brickell?
Learn more about selling your condo at Axis on Brickell with Josh Stein.
Thinking about Axis on Brickell?
I have sold South Florida property since 2002, more than $1 billion of it. Ask me for the recorded declaration, what has genuinely closed, or a straight answer on whether this building fits what you are after.
Josh Stein · Florida real estate sales associate, license SL3057661 · (305) 695-8257 · hello@joshsteinrealtor.comGet this building’s next recorded sale — before the listing sites catch up
- Every closed sale we can verify from the Miami-Dade record — price, date, and $/sqft when the deed supports it — not an IDX feed.
- Optional alert when a new deed posts in this building (or a short list of comps you choose).
- No spam inventory blasts. One building. One record. You decide what happens next.
Tell Josh which building. He’ll send the latest closed sales and set a quiet alert.
Get the sales recordRelated coverage
Part of Miami Luxury Condos.