

Miami Luxury Condos · Brickell · SLS Brickell
By Josh Stein · Florida license SL3057661 · Updated 27 October 2026Leer en español →
1 condo for sale at SLS Brickell, list price $691.77 per sq ft.
- Asking range$799,000
- List price per sq ft$691.77
- Months of inventory12.0
- Sold, 12 months1


Listing information is deemed reliable but is not guaranteed and is provided exclusively for consumers' personal, non-commercial use. Data is supplied by the MLS and may be subject to change or withdrawal without notice.
Last updated October 29, 2026, 3:02 pm
Key facts about SLS Brickell
| Address | 1300 S Miami Ave, Miami FL 33130 |
|---|---|
| For sale now | 1 |
| For rent now | 2 |
| List price range | $799,000 |
| Size | 1,155 sq ft |
| Bedrooms | 2 BR |
| List price per sq ft | Average $691.77, low $692, high $692 |
| Monthly HOA | $981 to $1,500 |
| Year built | 2016 |
| Amenities | Elevators, Fitness Center, Maintenance Grounds, Spa Hot Tub |
| Neighborhood | Miami |
Residences at SLS Brickell
| Bedrooms | For sale | Size (sq ft) | List price | Avg $/sq ft | Last sale |
|---|---|---|---|---|---|
| 1 | 0 | $650,000 (February 26, 2026) | |||
| 2 | 1 | 1,155 | $799,000 | $691.77 | |
| 3 or more | 0 | $930,000 (November 5, 2024) |
Verified 23 September 2026Miami-Dade County Property Appraiser1 source
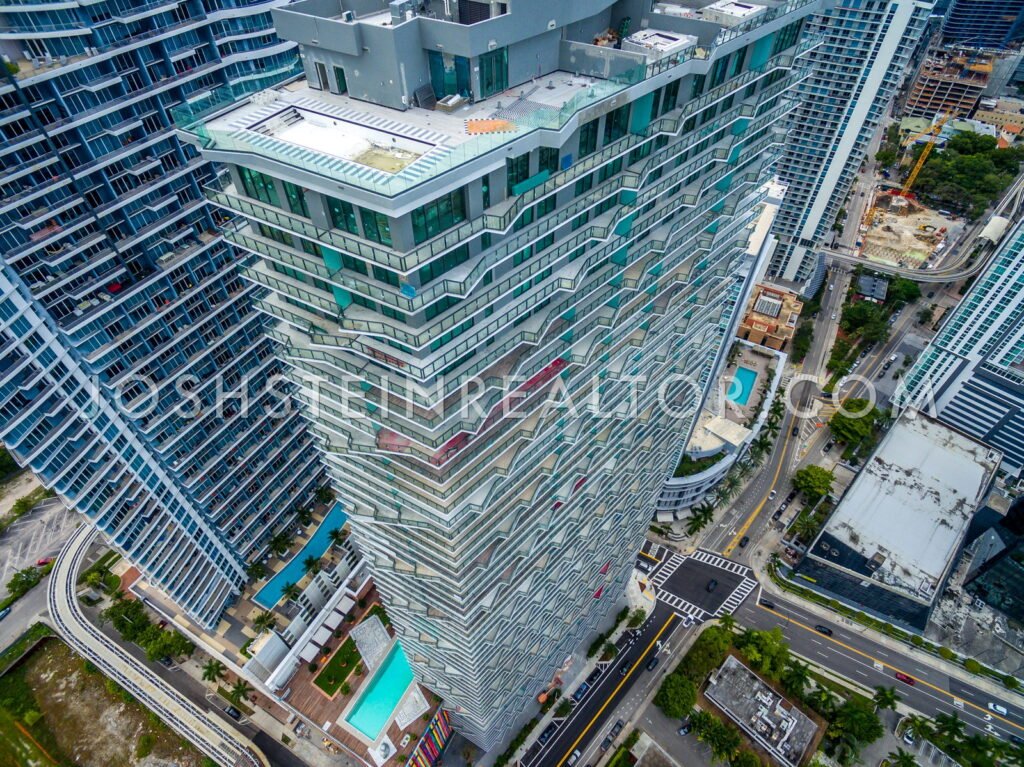
Aerial view of SLS Brickell in Brickell
Aerial view of SLS Brickell in Brickell
Aerial view of SLS Brickell in Brickell
On recorded 2026 sales this building runs $759 per square foot — cheaper than 66 of the 116 other buildings on the Miami Condo Index. Figures are closed sales from the Miami-Dade County Property Appraiser, not asking prices. Hover or tap a color to see the split.
Key Takeaways
- SLS Brickell recorded 17 sales in the 12 months to 23 September 2026, at a median of $780,000, or $762 per square foot, on the Miami-Dade County Property Appraiser record. The latest recorded sale was on 1 July 2026. Own at SLS Brickell? Ask Josh what yours would sell for on WhatsApp.
- Price per square foot has fallen in every one of the last four years — $817, then $806, then $790, then $759 — down 7.1% overall. Very few buildings decline this consistently; most of them zigzag.
- 112 qualified sales in four years — tied for the fourth deepest four-year record I have measured, level with SLS Lux Brickell and 900 Biscayne Bay and behind The Club at Brickell Bay, Opera Tower and Aria on the Bay, and at one home in sixteen it is also among the fastest-turning buildings I measure.
- 38 original buyers bought the same 1,279 square foot plan from the developer in 2016 and 2017 — at a median of $835,900. The resales of that identical plan in 2024 to 2026 have a median of $900,000 — 7.7% higher, nine years later, before any costs.
- Nine of the twenty-two owners who resold that plan sold for LESS than they paid — with the worst down 18.8%. Thirteen sold higher, the best by 30.0%. That is the real distribution behind a headline average.
- The building’s record sale has already resold at a loss — UPH2 went for $5,850,000 in November 2023 and $4,300,000 in March 2026 — the same home, down 26.5% in twenty-seven months.
- The hotel is not part of the residential condominium — the county records it as its own 353,788 square foot folio outside the condominium, alongside four separate store folios.
SLS Brickell, by the numbers
Developer: Related Group · Architect: Arquitectonica. Source: the building record on this site.
1300 South Miami Avenue, Miami, Florida 33130 | Neighborhood: Brickell
What the county record shows at 1300 South Miami Avenue
The Miami-Dade County Property Appraiser returns 460 folios at this address. 454 of them make up 1300 S MIAMI AVENUE CONDO, and 453 of those are homes; the remaining one is a land parcel with no building area. The other six folios are not part of the condominium at all. They sit under the older City of Miami South plat, and they are worth knowing about: one is the hotel itself, recorded as a single 353,788 square foot folio, one is a park, recreation and roadway parcel, and four are stores.
That separation matters if you are buying here. The hotel operation is a distinct property in the county’s eyes, not a share of what you own. Everything I measure below is the 453 residential homes only.
The bed mix is 157 one-bedrooms, 228 two-bedrooms, 59 three-bedrooms and nine four-bedrooms. Heated area runs from 570 to 2,268 square feet, median 961. The floorplate repetition here is the most regular I have come across: six plans with exactly 38 homes each — 1,281, 1,279, 1,154, 1,088, 880 and 699 square feet. That is 228 homes, half the building, in six identical stacks.
2026 assessed values run from $132,201 to $3,438,621, median $569,036.
Four years of sales, and a decline that never paused
112 qualified, arm’s-length sales across four years to 23 September 2026. Portfolio transfers are excluded and identical same-day transactions collapsed to one. This is a tied fourth deepest four-year record of any building I have measured, and it means the figures below are not hostage to one odd transaction.
| Year | Qualified sales | Median price | Median $/sq ft |
|---|---|---|---|
| 2023 | 45 | $685,000 | $817 |
| 2024 | 29 | $700,000 | $806 |
| 2025 | 26 | $790,000 | $790 |
| 2026 (to 23 September 2026) | 12 | $635,000 | $759 |
Read the right-hand column downwards. $817, $806, $790, $759 — down in every single year, 7.1% in total. I want to be precise about why that is unusual. Most buildings I measure move erratically, because a handful of sales in any one year can push a median around. This one declines in an orderly line across 112 transactions. The direction here is not an artefact. It is the clearest sustained per-foot decline in the index, and it is happening in one of the most actively traded buildings in Brickell.
Now look at the middle column, which does the opposite between 2023 and 2025: median price rises from $685,000 to $790,000, a gain of 15.3%, while the per-foot figure falls. The explanation is in the size of the home that sold — median 868 square feet in 2023, 961 in 2024, 1,088 in 2025. Buyers moved up the size range while paying less per foot for it. Nobody’s home appreciated 15.3%.
Turnover is roughly one home in sixteen per year, the joint quickest of any building in the index with 300 or more homes. If you need to be able to sell, this building can be sold. What the record says is that you may not like the price.
What happened to the people who bought from the developer?
This building offers something rare: a clean cohort. Thirty-eight homes share the 1,279 square foot plan, and the county records the original developer sales of all thirty-eight in 2016 and 2017, at a median of $835,900. Twenty-two of those homes have since sold again in qualified transactions. So we can ask a question most towers cannot answer — what did the first buyers actually get?
The resales of that plan in 2024 to 2026 carry a median of $900,000. Against the original median that is up 7.7% over roughly nine years, gross — before commissions, closing costs, taxes, assessments or the cost of carrying the home, none of which appear in the county record and none of which I am estimating for you.
The distribution is the more useful part. Of the twenty-two owners who resold, thirteen sold above what they paid and nine sold below. The median change was +4.4%. The best was +30.0%. The worst was −18.8%. Unit 2901 bought at $865,900 in 2016 and resold at $670,000 in 2021, then traded again at $875,000 in 2025. Unit 4301 paid $878,900 in 2017 and sold at $750,000 in 2021. Unit 3901 paid $901,900 in 2017 and sold at $850,000 in 2025 — eight years, and out at a loss.
The same pattern runs through the top of the building, at a much larger scale. UPH2, a 2,195 square foot three-bedroom, is the building’s record sale — and it has now traded three times. The developer sold it for $3,035,900 in June 2017. It resold for $5,850,000 in November 2023, a gain of 92.7% and $2,665 per square foot. In March 2026 it sold again for $4,300,000 — $1,959 per square foot, down 26.5% in twenty-seven months, though still 41.6% above what the first owner paid.
One home does not make a market, and the condition and finish of UPH2 at each sale are not in the record. But it is the same home each time, the size never changed, and the direction agrees with what all 112 sales say.
Who this building suits, and who it does not
It suits a buyer who wants evidence. With six identical 38-home stacks, 112 sales in four years and a full set of original developer prices on record, you can price a home here more precisely than almost anywhere in Brickell. Ask for the last three sales in your own stack, not a building average.
It suits a buyer who wants liquidity. One home in sixteen trades annually. There is nearly always a current comparable, and nearly always a buyer.
It does not suit a buyer expecting quick appreciation. Four consecutive years of per-foot decline, nine of twenty-two original owners exiting below their purchase price, and a record sale that has already resold 26.5% lower. None of that says the building is bad. It says the entry price is the thing that decides your outcome here, and the last decade did not reward paying up.
If you are selling here, price against your own stack and against the trend, not against 2023. The per-foot figure has fallen every year since, and this is a building where buyers can look up exactly what your neighbours got — the same public record I used is available to them. If your median-price comparable looks encouraging, check the square footage before you rely on it: the median home sold got 25% larger between 2023 and 2025, which is why the median price rose while the building did not.
Own at SLS Brickell?
If you own here, this page already carries the county’s record of what homes in SLS Brickell have sold for. Here is how to use it.
Your three options
- Sell. Price against what comparable homes in the building have actually recorded, not against asking prices.
- Rent it out. Within the condominium’s rental rules, which vary from building to building.
- Hold. Watch the record: this page is updated from the county as new sales are posted.
What I will send you
Tell me your unit. I will send you the recorded sales of comparable homes in SLS Brickell, what they sold for per square foot, and a straight read on what yours could sell for today.
Two free things for owners
Prefer email? hello@joshsteinrealtor.com
Josh Stein, Florida real estate sales associate, license SL3057661.SLS Brickell — Frequently Asked Questions
What have homes at SLS Brickell sold for in the last 12 months?
17 sales were recorded on the Miami-Dade County Property Appraiser record in the 12 months to 23 September 2026, at a median of $780,000 ($762 per square foot). The latest recorded sale was on 1 July 2026. These are recorded closings, not asking prices. If you own at SLS Brickell and want to know what your home would sell for, message Josh Stein on WhatsApp at (305) 695-8257.
How many homes are in SLS Brickell?
453. The county returns 460 folios at 1300 South Miami Avenue, but six of those sit outside the residential condominium — the hotel itself as a single 353,788 square foot folio, a park and roadway parcel, and four stores — and one folio inside it is land with no building area.
Is the SLS hotel part of the condominium?
No. The county records the hotel as its own folio outside 1300 S MIAMI AVENUE CONDO. The 453 residential homes are a separate set of folios, and everything measured on this page covers those only.
Are prices at SLS Brickell going up or down?
Down, and consistently. Median price per square foot has fallen in each of the last four years — $817 in 2023, $806 in 2024, $790 in 2025 and $759 in 2026 to 23 September, a total decline of 7.1%. That trend rests on 112 qualified sales, so it is not a small-sample effect.
Why does the median sale price look like it rose?
Because the homes that sold got bigger. The median home sold was 868 square feet in 2023 and 1,088 square feet in 2025, so the median price rose 15.3% over that period while the price paid per square foot fell. No individual home appreciated 15.3%.
Did the original buyers at SLS Brickell make money?
Some did and some did not. On the 1,279 square foot plan, the developer sold all 38 homes in 2016 and 2017 at a median of $835,900; resales of that plan in 2024 to 2026 have a median of $900,000, up 7.7% gross over about nine years. Of the 22 owners who have resold, 13 sold above what they paid and 9 sold below, the worst by 18.8%.
What is the most expensive home ever sold at SLS Brickell?
UPH2, a 2,195 square foot three-bedroom, at $5,850,000 in November 2023 — $2,665 per square foot. The same home sold again in March 2026 for $4,300,000, or $1,959 per square foot, 26.5% below its 2023 price and 41.6% above the $3,035,900 the developer sold it for in 2017.
How often do homes here change hands?
112 qualified sales across 453 homes in four years, roughly one home in sixteen per year. That is the joint quickest turnover of any building in this index with 300 or more homes, and it means current comparable sales are almost always available.
Sources and further reading
Interested in selling in SLS Brickell?
Learn more about selling your condo in SLS Brickell with Josh Stein.
Thinking about SLS Brickell?
I have sold South Florida property since 2002, more than $1 billion of it. Ask me for the recorded declaration, what has genuinely closed, or a straight answer on whether this building fits what you are after.
Josh Stein · Florida real estate sales associate, license SL3057661 · (305) 695-8257 · hello@joshsteinrealtor.comGet this building’s next recorded sale, before the listing sites catch up
- Every closed sale we can verify from the Miami-Dade record: price, date, and $/sqft when the deed supports it. Not an IDX feed.
- Optional alert when a new deed posts in this building (or a short list of comps you choose).
- No spam inventory blasts. One building. One record. You decide what happens next.
Tell Josh which building. He’ll send the latest closed sales and set a quiet alert.
Get the sales recordRelated coverage
Part of Miami Luxury Condos.