

Miami Luxury Condos · Bay Harbor Islands · Riva Bay Harbor
Every one of the 25 homes is a three-bedroom.
By Josh Stein · Florida license SL3057661 · Updated 29 September 2026
Verified 17 August 2026Miami-Dade County Property Appraiser1 source
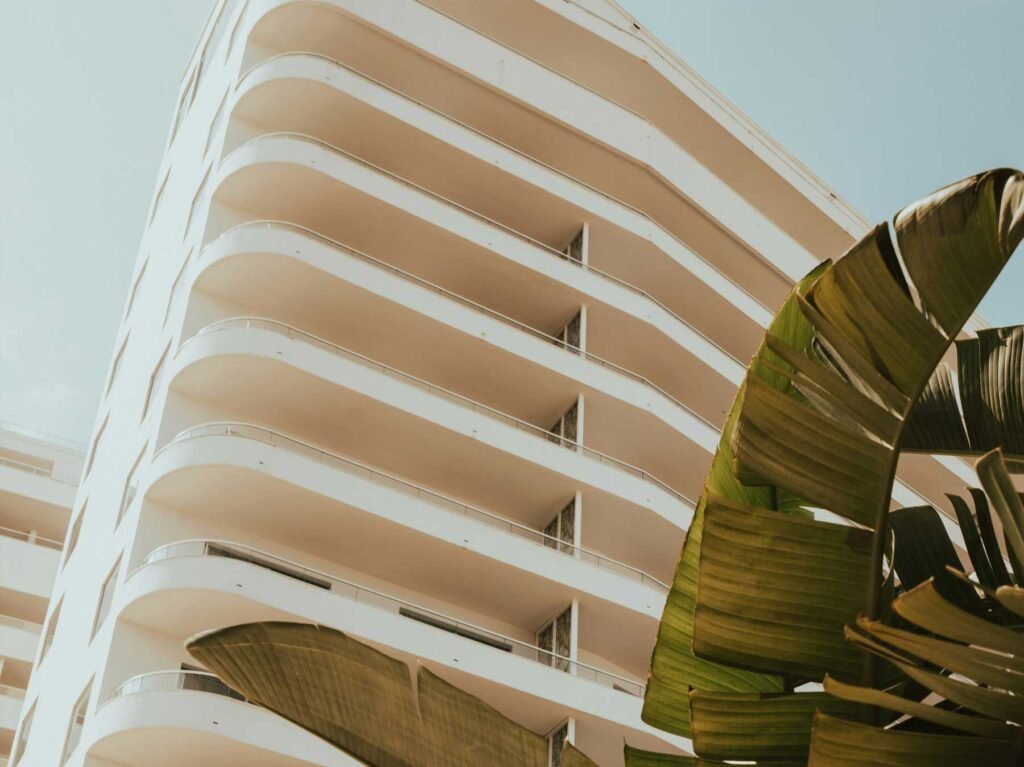
Riva Bay Harbor — photography to follow
Key Takeaways
- Riva Bay Harbor recorded only one sale in the 12 months to 23 September 2026 — on the Miami-Dade County Property Appraiser record, too few for a reliable median. The latest recorded sale was on 26 September 2025. Own at Riva Bay Harbor? Ask Josh what yours would sell for on WhatsApp.
- Every one of the 25 homes is a three-bedroom. — No other building in this series carries a single bedroom-count mix across its entire roll.
- Homes run 2,150 to 3,229 square feet, median 2,547. — A spread of roughly 50%, tight for a building this size.
- The 2026 median assessed value is $1,358,142. — Ranging $341,620 to $1,859,332 across the 25 folios.
- Only five qualified sales are recorded in four years. — None in 2026 so far, consistent with the building’s roughly one-sale-a-year pace.
- Per-foot pricing has held between $815 and $930 since 2023. — A narrow band, though the sample behind it is small.
- Ten of the 25 homes have a documented round trip. — Six sold for more than the owner paid, four for less, with a median gain of 40.4% held over a median of 8.0 years.
Riva Bay Harbor, by the numbers
Architect: Frankel Benayoun Architects. Source: the building record on this site.
9400 W Bay Harbor Drive, Miami, Florida | Neighborhood: Bay Harbor Islands
Twenty-five homes, and every one the same
Counted against the Miami-Dade County Property Appraiser record, Riva Bay Harbor returns 25 residential folios at 9400 W Bay Harbor Drive, with no commercial folios in the declaration.
All 25 are three-bedrooms. I have not measured another building in this series with a single bedroom count across the entire roll — most carry at least two or three configurations. Heated area runs 2,150 to 3,229 square feet, with a median of 2,547 — a spread of about 50%, itself tight for a building this size.
The 2026 assessed values run $341,620 to $1,859,332, with a median of $1,358,142 across the 25 folios. That range is wider than the size range, which tells me the assessment is not purely a function of square footage — floor level and view almost certainly account for the rest, though the county record does not break that out, and I am not going to guess at what it does not state.
The uniformity matters for what follows. In most buildings I have to warn a reader that the median sale price is unreliable because it moves on which homes traded — a smaller unit selling next to a larger one skews everything. Here, every home is the same bedroom count and a similar size, so the comparables mean roughly what they appear to mean.
What has this building actually sold for?
Qualified, arm’s-length sales only, from the county record.
| Year | Qualified sales | Median price | Median $/sq ft |
|---|---|---|---|
| 2023 | 1 | $2,000,000 | $930 |
| 2024 | 1 | $2,084,000 | $815 |
| 2025 | 3 | $2,035,000 | $880 |
| 2026 to date | 0 | — | — |
No qualified sales are recorded in 2026 to date. In a 25-home building averaging close to one sale a year, that alone is not unusual — but I would rather state it plainly than let a three-year table stand in for a four-year one.
Five qualified sales across four years is a thin record by any measure, well under the roughly ten I would want before drawing a trend, and I am not going to draw one here. What the record does support is a narrow band: median prices of $2,000,000, $2,084,000 and $2,035,000, and per-foot pricing between $815 and $930. Whether that reflects genuine price stability or simply too few data points to move the median, I cannot say with confidence on five sales — my honest reading is that the direction is flat, and the sample is thin enough that I would not be surprised by a swing either way on the next transaction.
On the four-year basis this series uses for every building — qualified sales divided by four, set against the home count — turnover here works out to one home in 20 each year. That is slow even for a small association, and it is the main reason the sample stays thin. If you think that basis understates how liquid the building actually is, you may have a point — but the method has to stay the same across every building in this series for the numbers to mean anything next to each other, so I am not changing it here.
What happened to the people who sold
Ten of Riva Bay Harbor’s 25 homes have a documented round trip in the county record — a qualified purchase followed by a qualified resale of the same unit, both legs verified against the county’s own qualified flag rather than price alone, so foreclosures and deeds-in-lieu are excluded from this count. Six sold for more than the owner paid; four sold for less. The median gain across all ten is +40.4%, held for a median of 8.0 years, with results ranging from −33.0% to +73.7%.
Among the strongest gains: unit 401 was bought for $1,140,000 in September 2013 and resold for $1,980,000 in September 2025, a +73.7% gain over almost exactly twelve years. Unit 701 shows the fastest turn on record — bought for $2,100,000 in September 2013 and sold again eleven months later, in September 2014, for $3,325,000, a +58.3% gain in a single year. That $3,325,000, at $1,030 a square foot, is still the highest price and the highest per-foot figure this building has ever recorded. Nothing since — including every sale in the four-year table above — has matched either number.
Not every owner did as well. Unit 201 sold for $775,000 in February 2020 against a $1,156,500 purchase in December 2013, a −33.0% loss over roughly six years — the worst result on record here. Unit 702 lost 22.6% over 5.4 years, and two more owners came out close to flat, at −17.2% and −3.6%.
I would rather set out the limits of this data than round it into a story. Ten round trips out of 25 homes is a real sample, not a token one, but the purchases span 2013 through 2016 and the resales span 2019 through 2025 — it does not isolate any one buying window as the right or wrong one. It tells you outcomes have varied, most owners gained, and a minority lost meaningfully. It does not tell you which year to buy in.
Who this building suits — and who it doesn’t
This suits a buyer who wants a three-bedroom in Bay Harbor Islands inside a small, closely held association, and who values price transparency over choice. Because every home here is the same bedroom count and a similar size, the comparables are about as reliable as this market gets — there is little room for an agent on either side to argue a given unit is meaningfully different from the other 24.
It suits a fast exit poorly. Turnover works out to about one home in 20 each year, and 2026 has produced no qualified sale yet. If liquidity matters more to you than price certainty, look elsewhere in this series.
A line for sellers specifically: that same uniformity works in your favor at the negotiating table — a buyer’s agent cannot easily argue your home is worth less than a near-identical unit that recently traded at $815 to $930 a foot, and the round-trip record shows more owners here have gained than lost. The same logic caps a buyer’s room to negotiate a unit down, for the same reason.
Riva Bay Harbor — Frequently Asked Questions
What have homes at Riva Bay Harbor sold for in the last 12 months?
Only one sale was recorded on the Miami-Dade County Property Appraiser record in the 12 months to 23 September 2026, too few to state a reliable median. The latest recorded sale was on 26 September 2025. A price for a specific home depends on its line, floor and condition. If you own at Riva Bay Harbor, message Josh Stein on WhatsApp at (305) 695-8257.
How many homes are in Riva Bay Harbor?
The Miami-Dade County Property Appraiser records 25 residential folios at 9400 W Bay Harbor Drive, with no commercial folios in the declaration. Every one of them is a three-bedroom.
What size are the residences?
Heated area runs from 2,150 to 3,229 square feet, with a median of 2,547. The 2026 assessed values run $341,620 to $1,859,332, with a median of $1,358,142.
What has Riva Bay Harbor actually sold for?
Five qualified sales across 2023 through 2025: a median of $2,000,000 in 2023, $2,084,000 in 2024, and $2,035,000 across three sales in 2025. Per-foot pricing has held between $815 and $930. No qualified sale is recorded in 2026 to date.
Is the market here trending up or down?
The record is too thin to call a trend — five qualified sales across four years is well short of what I would want before drawing one. What it does show is a narrow band, not a clear direction.
What is the highest price this building has recorded?
$3,325,000, for unit 701 in September 2014, at $1,030 a square foot. Both figures remain the building’s record more than a decade later, and no sale in the current four-year record has matched either.
Have owners here made money reselling?
Ten of the 25 homes have a documented round trip in the county record, verified against the qualified flag on both legs. Six sold for more than the owner paid and four sold for less; the median gain is 40.4% held over a median of 8.0 years, with results ranging from -33.0% to +73.7%.
Who is this building for?
A buyer who wants a three-bedroom in Bay Harbor Islands in a small, closely held association and values reliable comparables. It suits a fast exit poorly — turnover works out to about one home in 20 each year.
Sources and further reading
Thinking about Riva Bay Harbor?
I have sold South Florida property since 2002, more than $1 billion of it. Ask me for the recorded declaration, what has genuinely closed, or a straight answer on whether this building fits what you are after.
Josh Stein · Florida real estate sales associate, license SL3057661 · (305) 695-8257 · hello@joshsteinrealtor.comGet this building’s next recorded sale — before the listing sites catch up
- Every closed sale we can verify from the Miami-Dade record — price, date, and $/sqft when the deed supports it — not an IDX feed.
- Optional alert when a new deed posts in this building (or a short list of comps you choose).
- No spam inventory blasts. One building. One record. You decide what happens next.
Tell Josh which building. He’ll send the latest closed sales and set a quiet alert.
Get the sales recordRelated coverage
Part of Miami Luxury Condos.