

Miami Luxury Condos · Brickell · Nine at Mary Brickell Village
By Josh Stein · Florida license SL3057661 · Updated 30 September 2026
Verified 22 September 2026Miami-Dade County Property Appraiser1 source
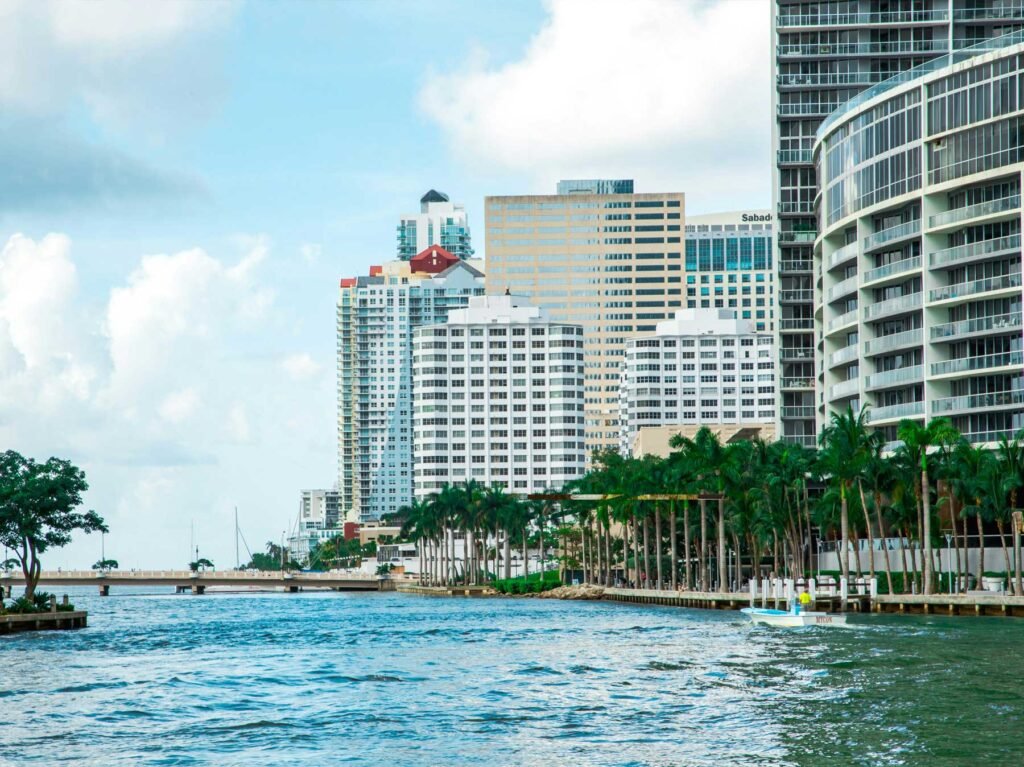
Nine at Mary Brickell Village — photography to follow
On recorded 2026 sales this building runs $608 per square foot — cheaper than 92 of the 117 buildings on the Miami Condo Index. Figures are closed sales from the Miami-Dade County Property Appraiser, not asking prices. Hover or tap a colour to see the split.
Key Takeaways
- Nine at Mary Brickell Village recorded 10 sales in the 12 months to 22 September 2026 — at a median of $614,000, or $570 per square foot, on the Miami-Dade County Property Appraiser record. The latest recorded sale was on 21 August 2026. Own at Nine at Mary Brickell Village? Ask Josh what yours would sell for on WhatsApp.
- Flat over four years (down 0.3%), on 85 qualified sales: the median went from $592 per square foot in 2023 to $590 in 2026 to date. Only 46 of the 97 buildings in my Miami Condo Index have enough recent sales to publish a change at all.
- Almost half its original buyers who resold, lost money: of the 180 resales by 2015 sell-out buyers, 46.1% sold for less than they paid, at a median gain of just 2.5%. Of the 40 resales by people who bought after 2015, only 12.5% lost.
- More than half the building has never resold — 203 of the 390 homes have recorded no qualified sale since the 2015 sell-out. Those owners’ outcomes are untested and are in none of the figures here.
- The record price is eleven years old — $1,280,000, paid on 28 May 2015 in the sell-out. Nothing since has beaten it. The per-foot record, by contrast, is recent — $1,208, set in June 2025.
- A supermarket is a folio inside the condominium — the county records a 73,862 sq ft retail unit here, assessed at $15,800,000 for 2026. It is not a residence and is excluded from every figure on this page.
- It is a two-bedroom building — 390 homes from 646 to 1,903 sq ft, median 1,097 — 150 one-bedrooms, 210 two-bedrooms and 30 three-bedrooms.
Nine at Mary Brickell Village, by the numbers
Developer: LYND & Starwood Capital · Architect: Behar Font & Associates. Source: the building record on this site.
999 SW 1st Avenue, Miami, Florida 33130 | Neighborhood: Brickell
What is actually in the building
The county returns 392 folios at 999 SW 1st Avenue. 390 are homes. One of the other two is a reference folio carrying no dwelling. The second is more interesting: a 73,862 sq ft retail unit classified by the Property Appraiser as a supermarket, assessed at $15,800,000 for 2026, filed inside the same condominium as the apartments. It is excluded from every residential figure here, but it is worth knowing that the ground floor of your building is a food store on the county’s own classification.
The homes run from 646 sq ft to 1,903 sq ft, median 1,097, and the mix is 150 one-bedrooms, 210 two-bedrooms and 30 three-bedrooms. The floorplates are unusually evenly spread — 22 homes each at 819, 945, 1,064, 1,274 and 1,373 sq ft, and 21 at 821 — which means most homes here have a genuine like-for-like comparable, and a recent one.
For 2026 the county assesses the homes between $176,054 and $842,398, median $452,825.
The price record
| Year | Qualified sales | Median price | Median $/sq ft |
|---|---|---|---|
| 2023 | 31 | $550,000 | $592 |
| 2024 | 24 | $682,500 | $588 |
| 2025 | 22 | $590,000 | $544 |
| 2026 to date | 8 | $614,000 | $590 |
This building publishes a four-year change: down 0.3% per square foot, from $592 in 2023 to $590 in 2026 to date. That it publishes at all is worth noting: my rule requires at least five qualified sales in both the opening and the closing year, and only 46 of the 97 buildings in my Miami Condo Index clear it.
But read it carefully. A 0.3% decline over four years is a real-terms loss, and the closing year rests on eight sales against the opening year’s 31. The middle of the window is softer than either end: $544 per square foot in 2025 across 22 sales. My honest reading is that this building has been flat to slightly soft since 2023, and that the 2026 rebound from 2025 is not yet supported by enough transactions to call a recovery.
Across the four-year window the building cleared a median $585 per square foot in a band from $451 to $1,208, at a median price of $615,000, on 85 qualified sales. That band is very wide for a building of this kind, and it is a size effect: the smallest homes carry by far the highest per-foot figures.
The record price is $1,280,000, paid on 28 May 2015 for an 1,832 sq ft home — $699 per square foot. It was set in the sell-out and has not been beaten in the eleven years since. The record price per square foot is the opposite story: $1,208, paid on 30 June 2025 for a 691 sq ft home at $835,000, and that is the most recent of the building’s high-water marks.
It trades at about one home in 18 a year, against a median of one in 23 across my index, slightly more active than typical.
What happened to the people who bought it new
This building sold out in a single year. 383 of its 609 recorded qualified sales fall in 2015, and everything about its ownership record follows from what was paid that year.
| When they bought | Resales | Sold at a loss | Median outcome |
|---|---|---|---|
| In the 2015 sell-out | 180 | 46.1% | +2.5% |
| After 2015 | 40 | 12.5% | +19.5% |
| All resales | 220 | 40.0% | +5.3% |
Nearly half the people who bought this building new and later sold it, sold it for less than they paid, and the median one made 2.5% across roughly a decade, a clear real-terms loss. The 40.0% overall loss rate is roughly double the median of 20.7% across the buildings I measure.
The people who bought after the sell-out did much better: a 12.5% loss rate and a median gain of 19.5%. The pattern is the one I find nearly everywhere: the outcome tracks the entry price, and here it is unusually stark because a single year set the entry for most of the building.
The extremes bracket it. The worst outcome on the record is an 819 sq ft home bought for $441,700 on 22 June 2015 and sold for $267,500 on 9 July 2020, down 39.4%. The best is a 691 sq ft home bought for $344,000 in June 2018, after the sell-out, and sold for $835,000 on 30 June 2025 — up 142.7%. Same building, holds of five and seven years, and the difference is almost entirely the price at which each owner got in.
One large caveat sits over all of this, and it should not be buried. Two hundred and three of the 390 homes, more than half the building, have recorded no qualified sale since 2015. Those owners have never tested the market and appear in none of the figures above. A building where half the losses simply have not been realised would look identical on this data to one where they do not exist.
There is also a genuinely better recent picture: of the 176 resales completed since the start of 2021, the loss rate is 29.0% against the 40.0% all-time figure, at a median gain of 8.0%. Better, but still above the corpus median, and still a thin gain for a five-to-ten-year hold.
Who this building suits, and who it does not
It suits a buyer who wants a two-bedroom in the middle of Brickell with a supermarket downstairs and a large, evenly distributed set of floorplates to compare against. With 22 homes on each of five sizes and about twenty sales a year, the comparable evidence here is deep.
It suits a buyer negotiating on the record. A seller here is arguing against a 40.0% resale loss rate and a 2015 cohort whose median outcome was 2.5% over a decade. That is a strong position to buy from, and every figure is public.
It suits badly a buyer who expects the 2015 prices to have been a floor. They were not. Nearly half the people who paid them and sold, lost money, and the building’s record price is still the one set that year.
It suits badly anyone underwriting appreciation. Four years at -0.3%, with a softer middle, is flat. Nothing in this record supports more than that.
If you are selling here, lead with the per-foot series rather than the price series, and be specific: $592, $588, $544 and $590 per square foot across 85 sales. The 2026 figure is the best since 2023 and it is yours to use, but a prepared buyer will point out it rests on eight sales, and you should have an answer ready. If you own one of the smaller homes, the June 2025 sale at $1,208 per square foot is the single most useful number on this page for you. What you should not do is anchor on the 2015 record of $1,280,000; it is eleven years old, and the cohort that set it is the one with a 46.1% loss rate.
Nine at Mary Brickell Village — Frequently Asked Questions
What have homes at Nine at Mary Brickell Village sold for in the last 12 months?
10 sales were recorded on the Miami-Dade County Property Appraiser record in the 12 months to 22 September 2026, at a median of $614,000 ($570 per square foot). The latest recorded sale was on 21 August 2026. These are recorded closings, not asking prices. If you own at Nine at Mary Brickell Village and want to know what your home would sell for, message Josh Stein on WhatsApp at (305) 695-8257.
How many homes are there at Nine at Mary Brickell Village?
Three hundred and ninety. The county returns 392 folios at 999 SW 1st Avenue, of which one is a reference folio and one is a 73,862 sq ft retail unit classified as a supermarket and assessed at $15,800,000 for 2026. The undivided ownership shares sum to 100%, which confirms the record is complete.
Are prices at Nine at Mary Brickell Village rising or falling?
Flat: down 0.3% over four years, from a median $592 per square foot in 2023 to $590 in 2026 to date, a real-terms loss. The middle of the window was softer, at $544 in 2025. Only 46 of the 97 buildings in my Miami Condo Index have enough qualified sales at both ends to publish a change at all.
How much does a home at Nine at Mary Brickell Village sell for?
On the 85 qualified sales in the four years to 22 September 2026, a median $585 per square foot in a band from $451 to $1,208, at a median price of $615,000. The band is wide because the smallest homes carry much the highest per-foot prices.
What does the resale record at Nine at Mary Brickell Village show?
Across 220 resales the loss rate is 40.0%, roughly double the median of 20.7% across the buildings I measure, at a median gain of 5.3%. It splits sharply on entry: 46.1% of the 180 sell-out buyers who resold took a loss, against 12.5% of the 40 who bought after 2015.
How much of Nine at Mary Brickell Village has never resold?
More than half. Two hundred and three of the 390 homes have recorded no qualified sale since the 2015 sell-out, so those owners’ outcomes are untested and appear in none of the resale figures on this page.
What is the highest price ever paid at Nine at Mary Brickell Village?
$1,280,000, on 28 May 2015, for an 1,832 sq ft home — $699 per square foot. It was set in the sell-out and has not been beaten in the eleven years since. The record price per square foot is more recent: $1,208, paid on 30 June 2025 for a 691 sq ft home at $835,000.
When did Nine at Mary Brickell Village sell out?
In 2015. Three hundred and eighty-three of the building’s 609 recorded qualified sales fall in that single year, which is why its ownership record turns so completely on what was paid then.
How big are the homes at Nine at Mary Brickell Village?
From 646 sq ft to 1,903 sq ft, median 1,097. The mix is 150 one-bedrooms, 210 two-bedrooms and 30 three-bedrooms, with 22 homes each at 819, 945, 1,064, 1,274 and 1,373 sq ft and 21 at 821.
Sources and further reading
Interested in selling in Nine at Mary Brickell Village?
Learn more about selling your condo in Nine at Mary Brickell Village with Josh Stein.
Thinking about Nine at Mary Brickell Village?
I have sold South Florida property since 2002, more than $1 billion of it. Ask me for the recorded declaration, what has genuinely closed, or a straight answer on whether this building fits what you are after.
Josh Stein · Florida real estate sales associate, license SL3057661 · (305) 695-8257 · hello@joshsteinrealtor.comGet this building’s next recorded sale — before the listing sites catch up
- Every closed sale we can verify from the Miami-Dade record — price, date, and $/sqft when the deed supports it — not an IDX feed.
- Optional alert when a new deed posts in this building (or a short list of comps you choose).
- No spam inventory blasts. One building. One record. You decide what happens next.
Tell Josh which building. He’ll send the latest closed sales and set a quiet alert.
Get the sales recordRelated coverage
Part of Miami Luxury Condos.