

Miami Luxury Condos · Sunny Isles Beach · Muse Residences
By Josh Stein · Florida license SL3057661 · Updated 30 September 2026
Verified 18 August 2026Miami-Dade County Property Appraiser1 source
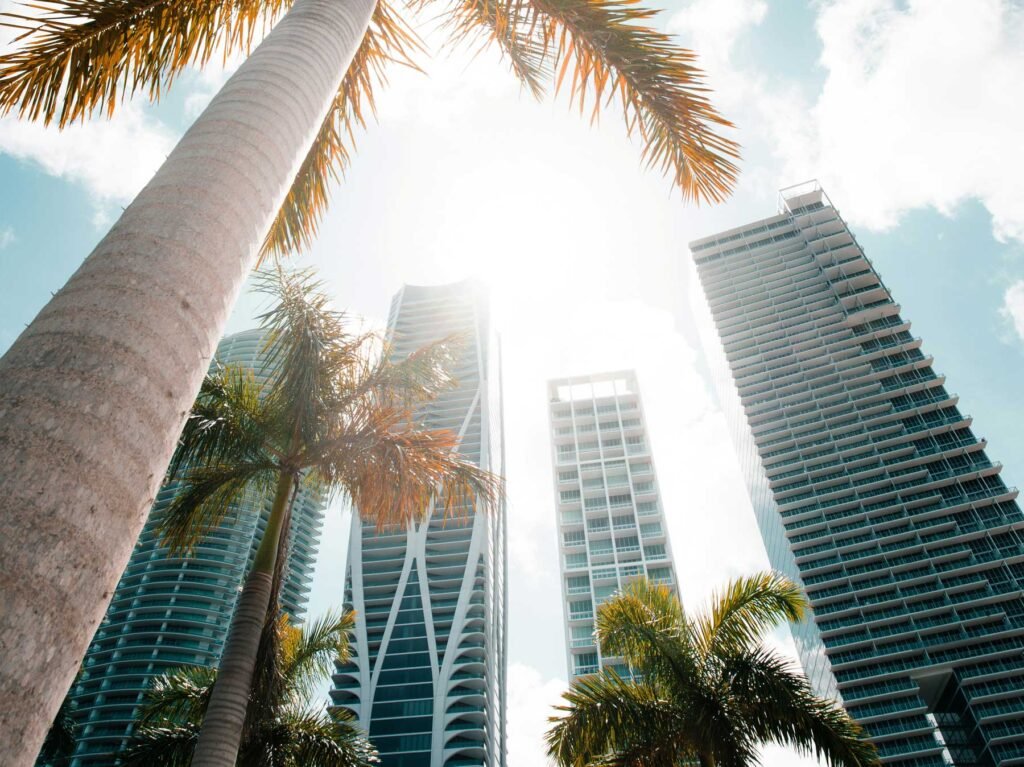
Muse Residences — photography to follow
On recorded 2026 sales this building runs $1,827 per square foot — more expensive than 104 of the 117 buildings on the Miami Condo Index. Figures are closed sales from the Miami-Dade County Property Appraiser, not asking prices. Hover or tap a colour to see the split.
Key Takeaways
- Muse Residences recorded 3 sales in the 12 months to 23 September 2026 — at a median of $4,000,000, or $1,698 per square foot, on the Miami-Dade County Property Appraiser record. The latest recorded sale was on 10 June 2026. Own at Muse Residences? Ask Josh what yours would sell for on WhatsApp.
- Eighteen of the 22 original buyers who have resold here lost money — that is 81.8%, at a median of −9.2%. It is the worst outcome for a sell-out cohort I have measured in any building.
- Across every resale on record, 60% lost money — 18 of 30, at a median of −0.9% over a 3.2-year hold. The median loss was 11.2% and the worst was 26.5%.
- None of that is a statement about the building itself — it is a statement about the 2018 entry price. 44 homes sold new that year at a median $4,615,000, or $1,547 per square foot, and the building has since traded in a band from $1,189 to $2,283.
- The most recent sale is the second-highest per-foot price in the building’s history — $4,000,000 on 10 June 2026 for a 2,044 sq ft two-bedroom — $1,957 per square foot, beaten only by a 2023 sale of a much larger home.
- Two floorplans are more than half the building — 25 homes at 3,195 sq ft and 11 at 3,262, with a further 18 at about 2,043. Nothing here is under 2,042 sq ft.
- Fourteen qualified sales in four years, so no four-year change is published — about one home in 18 a year, which is more liquid than the median of one in 24 across the buildings in my Miami Condo Index.
Muse Residences, by the numbers
Developer: Property Markets Group · Architect: Sieger Suarez Architects. Source: the building record on this site.
17141 Collins Avenue, Sunny Isles Beach, Florida 33160 | Neighborhood: Sunny Isles Beach
What is actually in the building
The county returns 63 folios for 17141 Collins Avenue. 62 are homes; the remaining one is a reference folio carrying no dwelling. There is no separately deeded parking, cabana or storage and no commercial folio.
The homes run from 2,042 sq ft to 6,524 sq ft, median 3,195, and there is no small stock at all. Four plans carry most of the building: 25 homes at 3,195 sq ft, 11 at 3,262, 10 at 2,042 and eight at 2,044. The bedroom mix is 18 two-bedrooms, 39 three-bedrooms and one four-bedroom; four further homes carry no bedroom count in the county record, and I have left those as the county has them rather than guess.
For 2026 the county assesses the homes between $2,067,978 and $11,642,400, median $3,624,556.
What happened to the people who bought new here?
Most of them lost money, and the figures are stark enough that they should be stated before anything else on this page.
The building sold through in 2018, when 44 homes — 71.0% of the building — changed hands at a median $4,615,000, or $1,547 per square foot. Of those original buyers, 22 have since resold. Eighteen of them sold for less than they paid.
That is 81.8%, at a median outcome of −9.2%. It is the worst result for a sell-out cohort I have measured in any building, and I have now measured this in a dozen or more. For context, the equivalent figures are 39.7% at Mosaic, 36.0% at Bentley Bay and 35.7% at Parque Towers — and 3.6% at Apogee South Beach, which sold out in 2008.
Across every resale on the county record here — 30 of them — 18 lost money, or 60.0%, at a median outcome of −0.9% over a 3.2-year hold. The median loss was 11.2% and the worst was 26.5%.
Now the important qualification, because these numbers are easy to misuse.
This is not evidence that the building has fallen in value, and it is not a reason to avoid it. It is evidence about one price, paid in one year, by almost everybody. The 2018 sell-out cleared at a median $1,547 per square foot. The four-year record since shows the building trading between $1,189 and $2,283 per square foot, with a median of $1,588 — which is to say the resale market has settled at roughly, and only roughly, where the developer priced it eight years ago. When an entire building buys at one number and that number turns out to be at or above the market, the resale statistics look exactly like this.
The practical reading, for a buyer today, is close to the opposite of the alarming one. You are not buying at the 2018 price; you are buying against a resale market that has already absorbed it. The two most recent sales in the building, in February and June 2026, cleared $1,698 and $1,957 per square foot — both above the 2018 median.
For a seller who bought in 2018, the reading is harder but worth having plainly: the odds have been against you, the median outcome in your cohort was a 9.2% loss, and the way to beat it is time rather than pricing.
The price record
| Year | Qualified sales | Median price | Median $/sq ft |
|---|---|---|---|
| 2023 | 6 | $4,950,000 | $1,710 |
| 2024 | 2 | $4,135,000 | $1,565 |
| 2025 | 4 | $4,875,000 | $1,471 |
| 2026 to date | 2 | $4,712,500 | $1,827 |
Fourteen qualified sales in four years. No four-year change is published and the building carries a dash in my Miami Condo Index: 2026 has recorded two qualified sales against the five I require at both ends.
The swings in that table are mix. The median home sold measured 3,195 sq ft in 2023, 2,620 in 2024, 3,228 in 2025 and 2,620 in 2026 — and the 2025 median is dragged down by a 5,359 sq ft home that cleared $1,189 per square foot, the lowest figure in the four-year record. Larger homes here trade at lower money per foot, which is the usual pattern and the reverse of what several other buildings on this stretch show.
Across all fourteen sales the building cleared a median $1,588 per square foot, in a band from $1,189 to $2,283, at a median price of $4,875,000. Liquidity is a genuine strength: one home in 18 a year, against a median of one in 24 across the buildings in my Miami Condo Index.
The highest price ever paid here is $14,134,700, on 28 September 2018 for the 5,686 sq ft upper penthouse — a sell-out purchase. That home resold on 26 July 2022 for $12,500,000, a loss of 11.6%. The building’s highest price per square foot is $2,283, paid on 6 September 2023 for a 5,431 sq ft home at $12,400,000; that home had sold in April 2019 for $10,610,000, so its owner gained 16.9%.
The most recent transaction is the encouraging one. On 10 June 2026 a 2,044 sq ft two-bedroom sold for $4,000,000 — $1,957 per square foot, the second-highest per-foot price in the building’s history and comfortably above the 2018 sell-out median.
Who this building suits, and who it does not
It suits a buyer who wants a large home in Sunny Isles Beach and is prepared to read the resale statistics correctly rather than be frightened by them. Everything here is over 2,000 sq ft, the building trades more often than most, and the recent per-foot prints are the strongest it has recorded.
It suits a buyer who can use the record in negotiation. In a building where 60% of resellers have taken a loss, a seller who bought in 2018 knows what the alternative to your offer looks like.
It suits badly anyone who expects a short hold to work. The median hold across resales here is 3.2 years and the median outcome across those was −0.9%. That is the clearest single argument on this page for buying to keep.
It suits badly a buyer who wants a small or entry-level home. Nothing here is under 2,042 sq ft.
If you are selling here, the two facts that matter most are opposed and you should know both. The unhelpful one is that 81.8% of your 2018 neighbours who sold did so at a loss, and a buyer’s agent who has done their homework will say so. The helpful one is that the two 2026 sales cleared $1,698 and $1,957 per square foot — both above the 2018 median of $1,547, and the June sale is the second-highest per-foot price this building has ever achieved. Price to those two, not to the 2025 median of $1,471, which was set by a much larger home. And if you bought in 2018 and can wait, the record on this page argues strongly for waiting.
Muse Residences — Frequently Asked Questions
What have homes at Muse Residences sold for in the last 12 months?
3 sales were recorded on the Miami-Dade County Property Appraiser record in the 12 months to 23 September 2026, at a median of $4,000,000 ($1,698 per square foot). The latest recorded sale was on 10 June 2026. These are recorded closings, not asking prices. If you own at Muse Residences and want to know what your home would sell for, message Josh Stein on WhatsApp at (305) 695-8257.
Have owners at Muse Residences made money?
Most have not. Of the 30 resales on the county record, 18 lost money — 60.0% — at a median outcome of −0.9% over a 3.2-year hold, a median loss of 11.2% and a worst case of 26.5%. Among the original 2018 buyers specifically, 18 of the 22 who have resold lost money: 81.8%, at a median of −9.2%.
Does that mean Muse is a bad building?
No. It is a statement about one price paid in one year by almost everybody. The 2018 sell-out cleared at a median $1,547 per square foot and the building has since traded between $1,189 and $2,283, median $1,588 — so the resale market has settled roughly where the developer priced it. A buyer today is not buying at the 2018 basis. The two 2026 sales cleared $1,698 and $1,957 per square foot, both above it.
How much does a home at Muse Residences sell for?
Across the fourteen qualified sales in the four years to August 2026 the building cleared a median $1,588 per square foot, in a band from $1,189 to $2,283, at a median price of $4,875,000. The two 2026 sales were at $1,698 and $1,957 per square foot.
How big are the homes at Muse?
From 2,042 sq ft to 6,524 sq ft, median 3,195, with nothing smaller. Four plans carry most of the building: 25 homes at 3,195 sq ft, 11 at 3,262, 10 at 2,042 and eight at 2,044. The mix is 18 two-bedrooms, 39 three-bedrooms and one four-bedroom, plus four homes the county records with no bedroom count.
What is the highest price ever paid at Muse Residences?
$14,134,700, on 28 September 2018, for the 5,686 sq ft upper penthouse — a sell-out purchase. That home resold on 26 July 2022 for $12,500,000, a loss of 11.6%. The highest price per square foot is $2,283, paid on 6 September 2023 for a 5,431 sq ft home at $12,400,000.
Have prices at Muse gone up or down?
No four-year change is published and the building carries a dash in my Miami Condo Index, because 2026 has recorded two qualified sales against the five I require at both ends. The yearly medians swing between $1,471 and $1,827 per square foot, and those swings are mix: the median home sold was 3,195 sq ft in 2023 and 2,620 sq ft in 2026.
How often do homes at Muse change hands?
The county records 14 qualified sales in the four years to August 2026 against 62 homes — about one home in 18 a year, more liquid than the median of one in 24 across the buildings in my Miami Condo Index.
Sources and further reading
Interested in selling at Muse Residences?
Learn more about selling your condo at Muse Residences with Josh Stein.
Thinking about Muse Residences?
I have sold South Florida property since 2002, more than $1 billion of it. Ask me for the recorded declaration, what has genuinely closed, or a straight answer on whether this building fits what you are after.
Josh Stein · Florida real estate sales associate, license SL3057661 · (305) 695-8257 · hello@joshsteinrealtor.comGet this building’s next recorded sale — before the listing sites catch up
- Every closed sale we can verify from the Miami-Dade record — price, date, and $/sqft when the deed supports it — not an IDX feed.
- Optional alert when a new deed posts in this building (or a short list of comps you choose).
- No spam inventory blasts. One building. One record. You decide what happens next.
Tell Josh which building. He’ll send the latest closed sales and set a quiet alert.
Get the sales recordRelated coverage
Part of Miami Luxury Condos.