

Miami Luxury Condos · Brickell · My Brickell
The entire building first sold in a single year.
By Josh Stein · Florida license SL3057661 · Updated 29 September 2026
Verified 21 August 2026Miami-Dade County Property Appraiser1 source
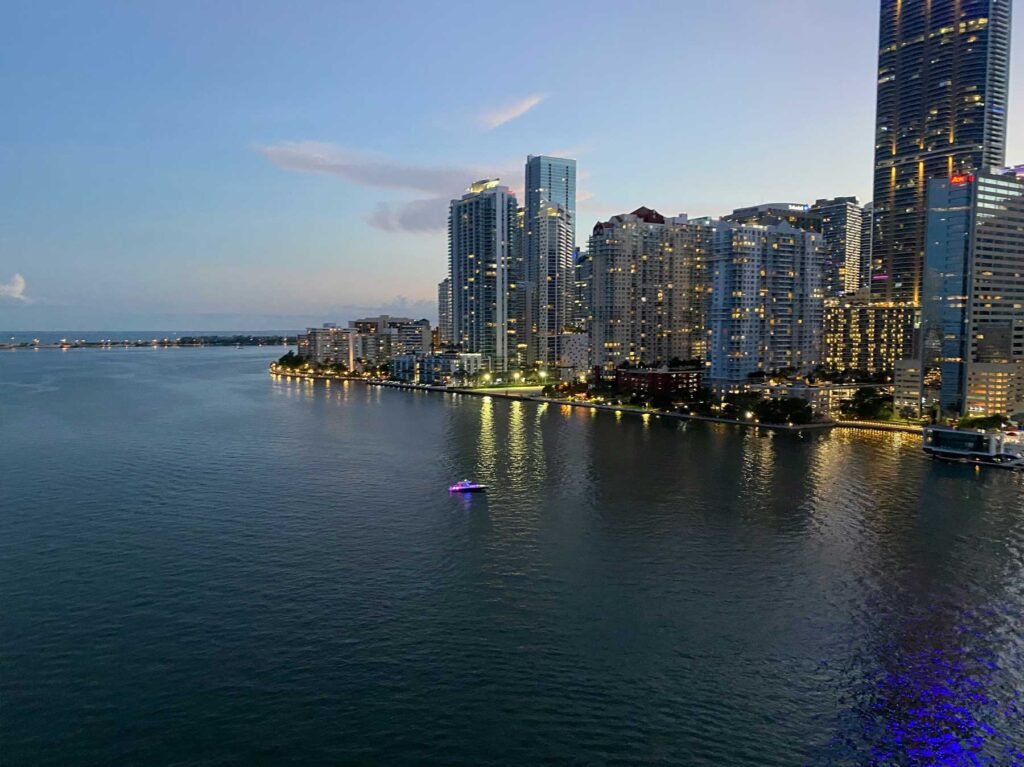
My Brickell — photography to follow
Key Takeaways
- My Brickell recorded only two sales in the 12 months to 23 September 2026 — on the Miami-Dade County Property Appraiser record, too few for a reliable median. The latest recorded sale was on 8 April 2026. Own at My Brickell? Ask Josh what yours would sell for on WhatsApp.
- The entire building first sold in a single year — 192 homes, all of them, in 2014 — at a median of $293,950 and $358 per square foot.
- One hundred and twenty of those buyers have since sold — 89 gained and 31 lost, a median of +19.1% over 7.7 years.
- The studios did best and the largest homes did worst — the 551 square foot plate returned a median of +28.6% with a 6.2% loss rate; the 1,116 square foot plate returned +0.7% with 44.4% of them selling at a loss.
- It is the most uniform building I have measured — six floorplates at exactly 24 homes each cover 144 of the 192 — so almost every home here has twenty-three identical comparables.
- The best result is a studio that more than doubled — $180,000 in February 2014 to $385,000 in March 2025.
- It is inexpensive and it trades slowly — 2026 assessed values run $183,540 to $498,049, median $341,736 — and about one home in twenty-eight changes hands each year.
My Brickell, by the numbers
Developer: Related Group · Architect: Arquitectonica · Starting at . Source: the building record on this site.
31 SE 6th Street, Miami, Florida 33131 | Neighborhood: Brickell
What is actually inside the building
The Miami-Dade County Property Appraiser holds 194 folios for MyBrickell at 31 SE 6th Street, of which 192 are homes. The other two are a single ground-floor commercial unit and an aggregate reference folio. The declaration’s common-element shares close at exactly 100.0000%, so this is the whole condominium.
One note if you go looking yourself: the county writes the name as a single word, MYBRICKELL, which is enough to make some searches come back empty.
The homes run 545 to 1,116 square feet, with a median of 719 — small throughout, with no exceptions at either end. The mix is 95 two-bedrooms, 49 studios and 48 one-bedrooms.
And then there is the thing that makes this building genuinely unusual to write about. Six floorplates cover 144 of the 192 homes — 1,116 square feet, 1,016, 719, 710, 551 and 545 — at exactly twenty-four homes apiece. I have not measured another building with that degree of regularity. It means almost every home here has twenty-three identical comparables, and it makes the analysis below far more reliable than a sample this size would normally allow.
The 2026 assessed values run $183,540 to $498,049, with a median of $341,736.
The studios beat the two-bedrooms
All 192 homes recorded their first qualified sale in 2014, at a median of $293,950 and $358 per square foot. Not most of them: all of them, in one year. Every completed round trip in this building starts from that common baseline, which is as clean an experiment as county data ever offers.
One hundred and twenty of the 192 have since sold. Eighty-nine gained and 31 lost, a median of +19.1% over a median holding period of 7.7 years. Of the 87 who sold in 2021 or later, 18.4% still sold at a loss, at a median of +24.7%. Seventy-two homes have never resold.
Because the plates are identical in blocks of twenty-four, they can be compared directly:
| Floorplate | Round trips | Sold at a loss | Median outcome |
|---|---|---|---|
| 545 sq ft (studio) | 16 | 12.5% | +37.5% |
| 551 sq ft (studio) | 16 | 6.2% | +28.6% |
| 1,086 sq ft | 17 | 35.3% | +26.3% |
| 842 sq ft | 13 | 15.4% | +19.1% |
| 1,016 sq ft | 12 | 16.7% | +18.9% |
| 710 sq ft | 17 | 29.4% | +15.9% |
| 719 sq ft | 11 | 45.5% | +1.3% |
| 1,116 sq ft | 18 | 44.4% | +0.7% |
The two studio plates have the lowest loss rates and the highest median gains in the building. The largest plate, at 1,116 square feet, has the worst of both: 44.4% of its owners sold at a loss and the median one is essentially flat after seven years.
The same thing shows up if you sort by what each buyer paid per square foot rather than by size. The cheapest quarter of 2014 entries — $266 to $328 per square foot — returned a median of +20.4% with a 16.7% loss rate. The dearest quarter, above $390, returned +1.1% with a 43.3% loss rate. The developer charged more per foot for the larger homes, and that premium has not come back.
The extremes, both from the same 2014 baseline:
- A 551 square foot studio bought for $180,000 in February 2014 sold for $385,000 in March 2025 — up 113.9%.
- A 545 square foot studio bought for $180,000 in January 2014 sold for $370,000 in February 2024 — up 105.6%.
- A 1,116 square foot home bought for $459,900 in January 2014 sold for $315,000 in August 2020 — down 31.5%.
The county record shows transactions and not reasons, so it cannot say why the small homes have done better. What it does establish, with twenty-four identical homes on each plate and a single common purchase year, is that the difference is real and not an artefact of which homes happened to sell. All figures are gross, before commissions, closing costs, taxes and assessments.
The price record
Qualified, arm’s-length sales from the county record, retrieved 21 August 2026.
| Year | Qualified sales | Median price | Median $/sq ft |
|---|---|---|---|
| 2023 | 9 | $430,000 | $534 |
| 2024 | 7 | $370,000 | $571 |
| 2025 | 10 | $462,500 | $549 |
| 2026 to date | 1 | $325,000 | $590 |
Twenty-seven qualified sales in four years across 192 homes is about one home in twenty-eight each year — low turnover, and low enough that a specific plate may not have traded in two years.
The median price column swings from $430,000 to $370,000 to $462,500 on seven to ten sales a year, which is mix, not movement: in a building of studios and two-bedrooms the median price simply reports which type sold. Per square foot the four years read $534, $571, $549 and $590 — a band of about $535 to $590, and no direction I would be willing to defend on 27 sales. 2026 is a single sale.
The highest price the building has ever recorded is $620,000, on 28 February 2024, for a 1,086 square foot home — $571 per square foot.
Set against a 2014 sell-out median of $358 per square foot, the current band represents roughly a 50% rise in the rate over twelve years. That is the plain arithmetic behind a +19.1% median outcome, and it is why the larger homes — which started well above that median rate — have struggled to clear it.
Who this building suits
It suits a buyer who wants an inexpensive, small home in Brickell and wants to know exactly what they are buying. A median assessed value of $341,736 in this location is the plain case, and twenty-three identical comparables for almost any home in the building is a rare luxury for a buyer.
It suits a studio buyer notably better than a two-bedroom buyer, and the evidence is unusually direct. Thirty-two completed round trips across the two studio plates show loss rates of 6.2% and 12.5% and median gains of +28.6% and +37.5%. Eighteen round trips on the largest plate show a 44.4% loss rate and no median gain at all.
It suits an investor who needs liquidity badly. One home in twenty-eight trades each year; if your plate has not sold recently you may be pricing into a vacuum, and 72 of the 192 homes have never changed hands at all.
It suits a buyer looking for a large home not at all — there isn’t one. The biggest apartment in the building is 1,116 square feet.
If you are selling here, you know exactly what your comparables are and so does the buyer: twenty-three homes identical to yours, all bought in 2014. Price against your own plate’s recent per-foot record, not the building median, which reports floorplate mix rather than value. And if you are on one of the studio plates, the record is materially better than the building headline — make sure it is on the table. Ask me for the per-foot record on your plate before you set a number.
MyBrickell — Frequently Asked Questions
What have homes at My Brickell sold for in the last 12 months?
Only two sales were recorded on the Miami-Dade County Property Appraiser record in the 12 months to 23 September 2026, too few to state a reliable median. The latest recorded sale was on 8 April 2026. A price for a specific home depends on its line, floor and condition. If you own at My Brickell, message Josh Stein on WhatsApp at (305) 695-8257.
Have owners at MyBrickell made money?
Most have. One hundred and twenty of the 192 homes have a complete round trip on record: 89 gained and 31 lost, a median of +19.1% over a median holding period of 7.7 years. Every one of those round trips begins in 2014, because the entire building first sold that year.
Which homes at MyBrickell have done best?
The studios, clearly. The 551 square foot plate returned a median of +28.6% with only 6.2% of its owners selling at a loss, and the 545 square foot plate +37.5% with a 12.5% loss rate. The largest plate, 1,116 square feet, returned +0.7% with 44.4% selling at a loss.
Why did the larger homes at MyBrickell do worse?
The county record shows what happened, not why. What it establishes is that the developer charged more per square foot for the larger homes in 2014, and that premium has not come back: the cheapest quarter of 2014 entries returned a median of +20.4%, the dearest quarter +1.1% with a 43.3% loss rate.
What is the best result recorded at MyBrickell?
A 551 square foot studio bought for $180,000 in February 2014 and sold for $385,000 in March 2025 — up 113.9%. A 545 square foot studio bought the same month for $180,000 sold for $370,000 in February 2024, up 105.6%.
What is the most expensive sale at MyBrickell?
$620,000 on 28 February 2024, for a 1,086 square foot home — $571 per square foot. This is a building of small homes, and that is the ceiling.
How often do homes at MyBrickell sell?
About one home in twenty-eight each year: 27 qualified sales across 2023, 2024, 2025 and 2026 to date, in 192 homes. Seventy-two of the 192 have never resold since the 2014 sell-out.
How big are the homes at MyBrickell?
From 545 to 1,116 square feet, with a median of 719. Ninety-five are two-bedrooms, 49 are studios and 48 are one-bedrooms. Six floorplates cover 144 of the 192 homes at exactly twenty-four apiece — 1,116 square feet, 1,016, 719, 710, 551 and 545 — so almost every home has twenty-three identical comparables. The 2026 assessed values run $183,540 to $498,049, median $341,736.
Sources and further reading
Interested in selling in My Brickell?
Learn more about selling your condo in My Brickell with Josh Stein.
Thinking about My Brickell?
I have sold South Florida property since 2002, more than $1 billion of it. Ask me for the recorded declaration, what has genuinely closed, or a straight answer on whether this building fits what you are after.
Josh Stein · Florida real estate sales associate, license SL3057661 · (305) 695-8257 · hello@joshsteinrealtor.comGet this building’s next recorded sale — before the listing sites catch up
- Every closed sale we can verify from the Miami-Dade record — price, date, and $/sqft when the deed supports it — not an IDX feed.
- Optional alert when a new deed posts in this building (or a short list of comps you choose).
- No spam inventory blasts. One building. One record. You decide what happens next.
Tell Josh which building. He’ll send the latest closed sales and set a quiet alert.
Get the sales recordRelated coverage
Part of Miami Luxury Condos.