

Miami Luxury Condos · Upper Eastside · IOS on the Bay
By Josh Stein · Florida license SL3057661 · Updated 12 October 2026Leer en español →
1 condo for sale at IOS on the Bay, list price $714.29 per sq ft.
- Asking range$695,000
- List price per sq ft$714.29
- Months of inventory2.4
- Sold, 12 months5


Listing information is deemed reliable but is not guaranteed and is provided exclusively for consumers' personal, non-commercial use. Data is supplied by the MLS and may be subject to change or withdrawal without notice.
Last updated 1 second ago
Key facts about IOS on the Bay
| Address | 720 NE 62nd Street, Miami FL 33138 |
|---|---|
| For sale now | 1 |
| For rent now | 2 |
| Pending | 1 |
| List price range | $695,000 |
| Size | 973 sq ft |
| Bedrooms | 2 BR |
| List price per sq ft | Average $714.29, low $714, high $714 |
| Monthly HOA | $846 to $2,275 |
| Year built | 2008 |
| Amenities | Business Center, Clubhouse, Elevators, Fitness Center, Maintenance Grounds, Picnic Area, Pool, Storage |
| Neighborhood | Miami |
Residences at IOS on the Bay
| Bedrooms | For sale | Size (sq ft) | List price | Avg $/sq ft | Last sale |
|---|---|---|---|---|---|
| 1 | 0 | $385,000 (August 12, 2025) | |||
| 2 | 1 | 973 | $695,000 | $714.29 | $619,000 (June 16, 2026) |
| 3 or more | 0 | $1,300,000 (February 16, 2026) |
Unit lines
| Line | Records | Bedrooms | Size (sq ft) |
|---|---|---|---|
| 03 | 2 | 2 BR | 1,098 to 1,177 |
| 11 | 2 | 2 BR | 966 to 972 |
The last two digits of the unit number (05 in 305, 405, 505).
Recently sold in
4 listings


Verified against public recordsMiami-Dade County Property Appraiser1 source
Key Takeaways
- IOS on the Bay recorded 5 sales in the 12 months to 23 September 2026 — at a median of $625,000, or $643 per square foot, on the Miami-Dade County Property Appraiser record. The latest recorded sale was on 16 June 2026. Own at IOS on the Bay? Ask Josh what yours would sell for on WhatsApp.
- 43 homes — make up IOS on the Bay per the Miami-Dade County Property Appraiser, and the building’s common-element shares reconcile to exactly 100.0000% — the record is complete.
- Only 12 qualified sales — closed here across the last four years — thin enough that I would not lean hard on any single year’s median.
- Median sale price fell 32.4% from 2023 to 2026 to date — but median $/sq ft fell only 11.0% over the same span — the gap between the two is the real story, not the headline number.
- Two of the building’s 43 homes are merged units — original apartment pairs combined into one folio, and I’ve excluded their historic sale prices from every $/sq ft figure because the county record doesn’t say whether a given sale happened before or after the merge.
- The building’s record sale is $2,420,500 — for a combined 3,143 sq ft home in August 2024 — the highest price ever recorded here, though I’m deliberately not publishing a $/sq ft for it.
- One home sold twice for the identical $925,000 — in December 2023 and again in January 2026 — a flat round trip across roughly two years.
IOS on the Bay, by the numbers
Recorded sales in the 12 months to 23 September 2026 ran from $610,000 to $1,300,000. Source: Miami-Dade County Property Appraiser.
720 NE 62 Street, Miami, Florida 33138 | Neighborhood: Upper Eastside
What’s Actually Inside IOS on the Bay
The Miami-Dade County Property Appraiser lists 43 folios at 720 NE 62 Street, all classified residential — there are no commercial folios in this declaration. I checked the county’s own math: every home’s declared share of the common elements, summed, reconciles to exactly 100.0000%. That’s not a small thing. On a lot of buildings I’ve pulled, an address search alone misses a wing or a handful of homes and the shares don’t add up. Here they do, on the first pull.
Bed count runs mostly two-bedroom: 28 of the 43 homes, against 12 one-bedrooms and 3 three-bedrooms. Size runs from 624 square feet up to 3,143, with a building median of 1,098. Two of the 43 homes are combined units — original apartment pairs merged at some point into a single folio, which is why the building’s two largest recorded sizes (3,143 and 2,669 square feet) sit well above everything else. I’ll come back to why that matters for pricing.
2026 assessed values run from $118,820 to $1,394,100, with a building median of $471,130 — a wide spread for a 43-home building, and an early signal that this isn’t one floorplan repeated 43 times.
Twelve Sales in Four Years — What the Record Does and Doesn’t Show
| Year | Qualified sales | Median price | Median $/sq ft |
|---|---|---|---|
| 2023 | 3 | $925,000 | $722 |
| 2024 | 2 | $1,620,250 | $696 |
| 2025 | 2 | $542,500 | $655 |
| 2026 to date | 5 | $625,000 | $643 |
A note on that 2024 row: its $/sq ft figure is drawn from only one of that year’s two sales. The other, $2,420,500 for a 3,143-square-foot home, sits on a folio the county records as “Units 512 & 513” — two original apartments merged into one, with the square footage updated to reflect the combined total. I don’t know whether that sale, or that same folio’s earlier 2012 and 2014 sales, happened before or after the merge, so I’m not dividing any of them by today’s footprint. More on that sale below.
Twelve qualified sales across four years — two to five a year — is a thin record, and I would not treat any single year’s number here as a verdict on the building. What I can say with more confidence: median $/sq ft fell 11.0% from 2023 to 2026 to date, $722 down to $643. Median sale price, by contrast, fell 32.4% over the same span — a much bigger swing that has more to do with which homes happened to trade in a given year than with any real change in the building’s value. This is exactly why I lead with $/sq ft here: on two to five sales a year, median price is easily moved by one large or small home closing, and that’s what happened between 2023 and 2026.
My honest reading: the direction — modestly softer pricing since 2023 — is probably real. The magnitude is not something I’d defend to the decimal, given how few sales sit behind it.
What Does the Building’s Biggest Sale Actually Tell You?
The highest price ever recorded at IOS on the Bay is $2,420,500, closed August 26, 2024. It’s a genuine, single-folio, arm’s-length sale — no portfolio flag, no multi-parcel language, nothing that calls the price itself into question. But the home behind it isn’t a standard unit: the folio is recorded as “Units 512 & 513,” meaning two original apartments were merged into one 3,143-square-foot residence at some point in the building’s history. That same folio also sold for $1,730,000 in 2014 and $1,370,000 in 2012.
I’m publishing all three prices. I’m not publishing a price per square foot for any of them. The county keeps a combined folio’s sale history filed under its current, post-merger square footage — which means an older sale of just one of the two original apartments can end up divided by the size of both, understating the true price per foot. I have no way to confirm from this record whether the 2012 and 2014 sales happened before or after the two units were joined, so dividing them would be a guess dressed up as a number. The building holds a second combined home too — 2,669 square feet, units 505 and 506 — with one sale on record, in 2011, outside this page’s four-year window.
What the record does support without qualification: this is the most expensive home in the building by a wide margin, and its three recorded sales — 2012, 2014, 2024 — show a home that traded up meaningfully over twelve years, even without a defensible per-foot number attached to any single leg of it.
Elsewhere in the record, one home tells the opposite kind of story. Unit 306, a 1,230-square-foot two-bedroom, sold for $925,000 in December 2023 and again for the identical $925,000 in January 2026 — a flat round trip across roughly two years, no gain, no loss. It’s the same home that sold for $400,000 in 2009 and $600,000 in 2016, so the longer arc is a real gain; the most recent leg simply wasn’t part of it.
Who IOS on the Bay Suits, and Who It Doesn’t
This is a small, boutique building on Biscayne Bay in Miami’s Upper Eastside, and the sales record reads like one: two to five closings a year, a turnover rate of roughly one home in 14 each year on the four-year basis I use across every building in this series. That favors a patient buyer. Looking at every home that has completed a full buy-and-sell round trip (first purchase to last sale, one trip per home), 34 of the 43, 32 sold for more than they paid and 2 sold for less, a median gain of 52.4%, but the median holding period behind that gain is 10.2 years, with individual outcomes ranging from -22.2% to +131.2%. This building rewards people who plan to stay.
The bed mix leans two-bedroom (28 of 43), with real range in both size and price: an assessed low of $118,820 at one end, a combined 3,143-square-foot residence that last traded above $2.4 million at the other. That spread means the building can suit very different budgets, but it also means “comparable sale” needs real care here — a two-bedroom on one floor and a merged three-bedroom two floors up aren’t the same product, even inside one building.
Who it suits badly: anyone counting on a deep, current comp set to negotiate against, or planning a fast resale. With this few sales a year, the freshest comp in your line could be well over a year old. If you’re selling here, I would rather price off the building’s full sale history — including how long homes here typically hold before reselling — than lean on whatever happens to have closed most recently.
Own at IOS on the Bay?
If you own here, this page already carries the county’s record of what homes in IOS on the Bay have sold for. Here is how to use it.
Your three options
- Sell. Price against what comparable homes in the building have actually recorded, not against asking prices.
- Rent it out. Within the condominium’s rental rules, which vary from building to building.
- Hold. Watch the record: this page is updated from the county as new sales are posted.
What I will send you
Tell me your unit. I will send you the recorded sales of comparable homes in IOS on the Bay, what they sold for per square foot, and a straight read on what yours could sell for today.
Two free things for owners
How this building compares: the Miami Condo Index ranks buildings by price per square foot and four-year change from the county record, the Miami Resale Record shows how often resales closed below the seller’s price, and the 100 Latest Sales list shows MLS closings as they post. Every building we cover is on the Miami Luxury Condos page.
IOS on the Bay — Frequently Asked Questions
What have homes at IOS on the Bay sold for in the last 12 months?
5 sales were recorded on the Miami-Dade County Property Appraiser record in the 12 months to 23 September 2026, at a median of $625,000 ($643 per square foot). The latest recorded sale was on 16 June 2026. These are recorded closings, not asking prices. If you own at IOS on the Bay and want to know what your home would sell for, message Josh Stein on WhatsApp at (305) 695-8257.
How many homes are in IOS on the Bay?
Forty-three, according to the Miami-Dade County Property Appraiser. All 43 folios are classified residential — there are no commercial folios in the declaration — and the building’s common-element shares reconcile to exactly 100.0000%, confirming the county pull is complete.
What is the median price per square foot at IOS on the Bay?
Yearly medians have run from $643 to $722 a square foot across the last four qualified-sales years, with 2023’s three sales at a median of $722 and 2026’s five sales (to date) at $643, an 11.0% decline. I lead with $/sq ft rather than median price here, because the two disagree: median price fell 32.4% over the same span, driven by which homes happened to sell rather than by a genuine drop in value.
What does the sale record show about IOS on the Bay’s prices?
The record is thin — only 12 qualified sales across four years, two to five a year — so I would not treat any single year’s number as a verdict. What I can say: $/sq ft is down 11.0% from 2023 to 2026 to date, a real but modest decline given how few sales are behind it. Over the longer record, 34 of the 43 homes have completed a full buy-and-sell round trip (first purchase to last sale, one trip per home): 32 sold for more than they paid and 2 for less, a median gain of 52.4% over a median holding period of 10.2 years.
What’s the biggest sale ever recorded at IOS on the Bay?
$2,420,500, closed August 26, 2024, for a 3,143 sq ft home combining what were originally two separate apartments (units 512 and 513). It’s the highest price on record here. I’m not publishing a price-per-square-foot for it: the county updated this folio’s square footage to the combined total, and I can’t confirm the 2024 sale — or its two earlier sales, in 2012 and 2014 — happened after that combination rather than before. Dividing an old price by today’s larger footprint would risk fabricating a number.
How often do homes turn over at IOS on the Bay?
About one home in 14 each year, on the four-year basis I use across every building in this series (43 homes against an average of 3 qualified sales a year). That’s a modestly illiquid building — comps here take patience to assemble.
Is IOS on the Bay a good fit for a quick resale?
Probably not the first building I’d point to. With only two to five qualified sales a year, there isn’t a deep, current comp set to price against, and the record shows homes here typically hold for a decade or more between sales — the median round-trip holding period is 10.2 years. It suits a buyer planning to stay, not one planning to flip.
What don’t we know about IOS on the Bay from this record?
The architect and the amenities are not in the county’s property record, so the background paragraph at the foot of this page is descriptive, not county data. The record does give the year built (2008), the 5-story zoning and, reliably: folio-by-folio size, bed count, 2026 assessed value, and every qualified sale back through the building’s history.
Sources and further reading
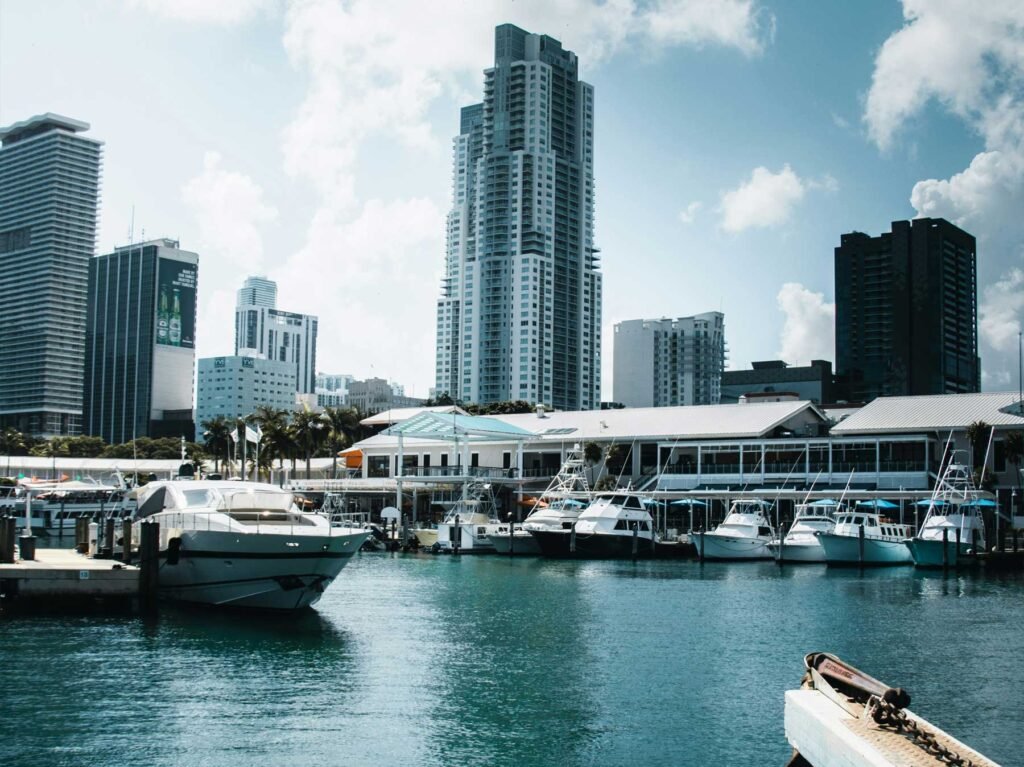
Located in Miami’s Upper Eastside, IOS on the Bay is a modern style boutique building located on Biscayne Bay. Built in 2008, this contemporary designed building features two towers, the north a 5 story tower and the second building (south tower) a 3 story building. The county record counts 43 homes in all. The minimalist buildings were designed by Bravo Architecture.
All of the residences at IOS on the Bay have either beautiful bay views or garden views and the condos are finished to a very high end. The building has a bayfront pool and a fitness center, and it is minutes from some of Miami’s best restaurants, bars and shopping.
Interested in selling at IOS on the Bay?
Learn more about selling your condo at IOS on the Bay with Josh Stein.
Thinking about IOS on the Bay?
I have sold South Florida property since 2002, more than $1 billion of it. Ask me for the recorded declaration, what has genuinely closed, or a straight answer on whether this building fits what you are after.
Josh Stein · Florida real estate sales associate, license SL3057661 · (305) 695-8257 · hello@joshsteinrealtor.comGet this building’s next recorded sale — before the listing sites catch up
- Every closed sale we can verify from the Miami-Dade record — price, date, and $/sqft when the deed supports it — not an IDX feed.
- Optional alert when a new deed posts in this building (or a short list of comps you choose).
- No spam inventory blasts. One building. One record. You decide what happens next.
Tell Josh which building. He’ll send the latest closed sales and set a quiet alert.
Get the sales recordRelated coverage
Part of Miami Luxury Condos.