

Miami Luxury Condos · Bay Harbor Islands · Bijou Bay Harbor
The median hold between purchase and resale here is about eleven and a half months.
By Josh Stein · Florida license SL3057661 · Updated 1 October 2026
Verified 18 August 2026Miami-Dade County Property Appraiser1 source
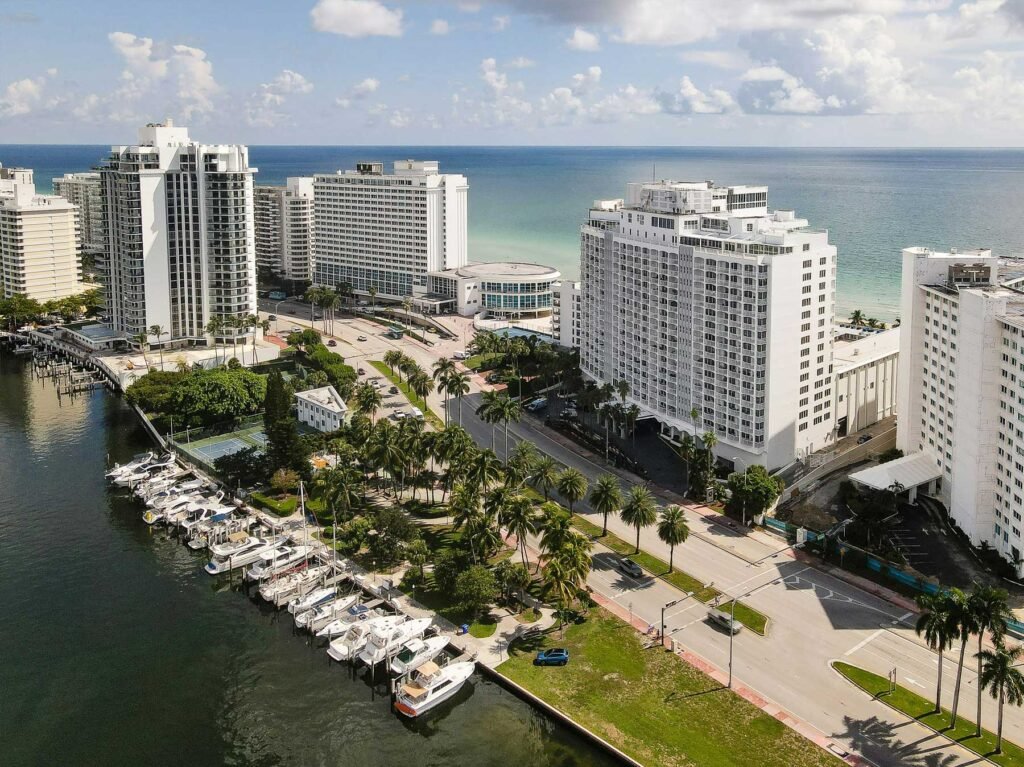
Bijou Bay Harbor — photography to follow
On recorded 2026 sales this building runs $1,063 per square foot — more expensive than 81 of the 116 other buildings on the Miami Condo Index. Figures are closed sales from the Miami-Dade County Property Appraiser, not asking prices. Hover or tap a color to see the split.
Key Takeaways
- Bijou Bay Harbor recorded only two sales in the 12 months to 23 September 2026 — on the Miami-Dade County Property Appraiser record, too few for a reliable median. The latest recorded sale was on 31 March 2026. Own at Bijou Bay Harbor? Ask Josh what yours would sell for on WhatsApp.
- The median hold between purchase and resale here is about eleven and a half months. Of the 27 resales on record, the typical one happened inside a year of the purchase.
- And almost none of those quick trades lost money — two of 27, or 7.4%, at a median gain of 18.9%. The worst outcome in the building’s history is a loss of 8.4%.
- The whole building changed hands in 2021 — 46 qualified sales that year against 41 homes, at a median $902,600, or $743 per square foot. Everything since has been resale.
- It trades about twice as often as the index median: fourteen qualified sales in four years against 41 homes, about one home in 12 a year, against a median of one in 23.
- The 2026 sale is the highest per-foot price of the last four years — $2,220,000 on a 2,089 sq ft home — $1,063 per square foot, against a four-year median of $863.
- The record is $2,300,000 — paid on 22 June 2022 for a 2,082 sq ft home at $1,105 per square foot.
Bijou Bay Harbor, by the numbers
Developer: Ability by Acierto · Architect: Revuelta · Lowest sale since 2022: $725,000 (17 February 2025). Source: Miami-Dade County Property Appraiser.
9521 E. Bay Harbor Drive, Bay Harbor Islands, Florida 33154 | Neighborhood: Bay Harbor Islands
What is actually in the building
The county returns 41 folios for 9521 East Bay Harbor Drive, and every one of them is a home — no reference folio, no commercial unit, no separately deeded parking, cabana or storage.
The homes run from 826 sq ft to 2,089 sq ft, median 1,345, and the building splits into two clear halves: a group of 26 homes at or below 1,345 sq ft, and 15 above 1,666. The most common plans are 1,019 sq ft (seven homes), 1,345 (six), and 980, 985, 1,670 and 2,089 with five each. The bedroom mix is 19 one-bedrooms, 14 two-bedrooms and eight three-bedrooms.
For 2026 the county assesses the homes between $564,877 and $1,683,624, median $1,146,350.
Why does everybody here sell so quickly?
I do not know why, and I am not going to guess. But the measurement is unusual enough to lead with.
The county records 27 resales at this address. The median time between the purchase and the resale is 0.96 years, about eleven and a half months.
Two things make that interesting rather than alarming.
The first is that the quick trades have overwhelmingly worked. Of those 27 resales, two lost money — 7.4% — at a median gain of 18.9%. The worst single outcome in the building’s history is a loss of 8.4%, and the median loss is 5.5%. In most buildings a short hold is where the losses concentrate; here it is where the gains are.
The second is the context. The building changed hands in bulk in 2021 — 46 qualified sales against 41 homes, at a median $902,600, or $743 per square foot. A building that sells out entirely in one year and then sees a rapid churn of resales at higher prices is describing a specific moment rather than a permanent characteristic. Whether the 0.96-year median is a lasting feature of this address or an artifact of 2021 and 2022 is not something four years of data can settle.
What it does establish, for a buyer or a seller, is that this building trades. Fourteen qualified sales in the last four years against 41 homes works out at one home in 12 per year, nearly twice the median of one in 23 across the buildings in my Miami Condo Index. In a 41-home building that is a genuinely useful fact: you will have comparables, and you will have a realistic exit.
The price record
| Year | Qualified sales | Median price | Median $/sq ft |
|---|---|---|---|
| 2023 | 5 | $830,000 | $843 |
| 2024 | 6 | $1,167,500 | $873 |
| 2025 | 2 | $777,500 | $860 |
| 2026 to date | 1 | $2,220,000 | $1,063 |
Look at the median price column and then at the per-foot column, because the gap between them is the whole point. Median price falls 33% from 2024 to 2025 and then nearly triples in 2026. Median price per square foot moves from $873 to $860 to $1,063. The price column is measuring which homes sold — the median home was 1,328 sq ft in 2024, 906 in 2025 and 2,089 in 2026 — and almost nothing else.
No four-year change is published and the building carries a dash in my Miami Condo Index: 2026 has recorded one qualified sale against the five I require at each end.
Across the fourteen sales the building cleared a median $863 per square foot, in a band from $815 to $1,063, at a median price of $832,500. That band is unusually tight — a factor of 1.3 — in a building whose homes vary by 153% in size, which suggests that per-foot pricing travels reasonably well between plans here.
The record is $2,300,000, paid on 22 June 2022 for a 2,082 sq ft home at $1,105 per square foot, which is also the building’s highest per-foot price. The single 2026 sale, at $1,063 per square foot, is the second highest and the strongest recent signal the building has.
Who this building suits, and who it does not
It suits a buyer who wants to be able to get out again. One home in 12 a year in a 41-home building is nearly twice the Miami Condo Index median of one in 23, and the resale record shows two of 27 resales below the purchase price, with a worst case of 8.4%.
It suits a buyer at the smaller end who wants Bay Harbor Islands without Bay Harbor Islands prices: nineteen of the 41 homes are one-bedrooms, and the four-year band starts at $815 per square foot.
It suits badly anyone who wants a settled, long-tenured building. The typical resale here came within a year of the purchase, which is a different neighbor profile from a building where people stay a decade, and it is worth knowing before you buy.
It suits badly a buyer relying on the median price. As the table above shows, it swings by a factor of three on samples of one to six sales.
If you are selling here, two things work in your favour and you should use both. The first is liquidity: this building trades nearly twice as often as the Miami Condo Index median, so a buyer who walks away is more easily replaced. The second is the recent evidence — the single 2026 sale cleared $1,063 per square foot against a four-year median of $863, and the per-foot band here is tight enough that it is a fair comparable even for a differently sized home. What you should not lean on is the median price, which was $777,500 in 2025 and $2,220,000 in 2026 for reasons that have nothing to do with the market.
Bijou Bay Harbor — Frequently Asked Questions
What have homes at Bijou Bay Harbor sold for in the last 12 months?
Only two sales were recorded on the Miami-Dade County Property Appraiser record in the 12 months to 23 September 2026, too few to state a reliable median. The latest recorded sale was on 31 March 2026. A price for a specific home depends on its line, floor and condition. If you own at Bijou Bay Harbor, message Josh Stein on WhatsApp at (305) 695-8257.
How quickly do homes at Bijou Bay Harbor resell?
Quickly. Across the 27 resales on the county record, the median time between purchase and resale is 0.96 years, about eleven and a half months.
What does the resale record show at Bijou Bay Harbor?
Of the 27 resales on the county record, two sold below the prior price (7.4%) and the median change was +18.9%. The worst single outcome in the building’s history is a loss of 8.4%, and the median loss is 5.5%. That is the record to date, not a forecast.
How much does a home at Bijou Bay Harbor sell for?
Across the fourteen qualified sales since January 2023 the building cleared a median $863 per square foot, in a band from $815 to $1,063, at a median price of $832,500. The single 2026 sale was at $1,063 per square foot.
Why does the median price jump around so much?
Because it is tracking which home sold rather than the market. The median home sold was 1,328 sq ft in 2024, 906 sq ft in 2025 and 2,089 sq ft in 2026, which is why the median price runs $1,167,500, then $777,500, then $2,220,000. Over the same period median price per square foot moved only from $873 to $860 to $1,063.
How big are the homes at Bijou Bay Harbor?
From 826 sq ft to 2,089 sq ft, median 1,345. The mix is 19 one-bedrooms, 14 two-bedrooms and eight three-bedrooms, and the building splits into a group of 26 homes at or below 1,345 sq ft and 15 above 1,666.
What is the highest price ever paid at Bijou Bay Harbor?
$2,300,000, on 22 June 2022, for a 2,082 sq ft home — $1,105 per square foot, which is also the building’s highest price per square foot.
How often do homes at Bijou Bay Harbor change hands?
The county records 14 qualified sales since January 2023 against 41 homes, about one home in 12 a year, nearly twice the median of one in 23 across the buildings in my Miami Condo Index.
Sources and further reading
Interested in selling at Bijou Bay Harbor?
Learn more about selling your condo at Bijou Bay Harbor with Josh Stein.
Thinking about Bijou Bay Harbor?
I have sold South Florida property since 2002, more than $1 billion of it. Ask me for the recorded declaration, what has genuinely closed, or a straight answer on whether this building fits what you are after.
Josh Stein · Florida real estate sales associate, license SL3057661 · (305) 695-8257 · hello@joshsteinrealtor.comGet this building’s next recorded sale — before the listing sites catch up
- Every closed sale we can verify from the Miami-Dade record — price, date, and $/sqft when the deed supports it — not an IDX feed.
- Optional alert when a new deed posts in this building (or a short list of comps you choose).
- No spam inventory blasts. One building. One record. You decide what happens next.
Tell Josh which building. He’ll send the latest closed sales and set a quiet alert.
Get the sales recordRelated coverage
Part of Miami Luxury Condos.