

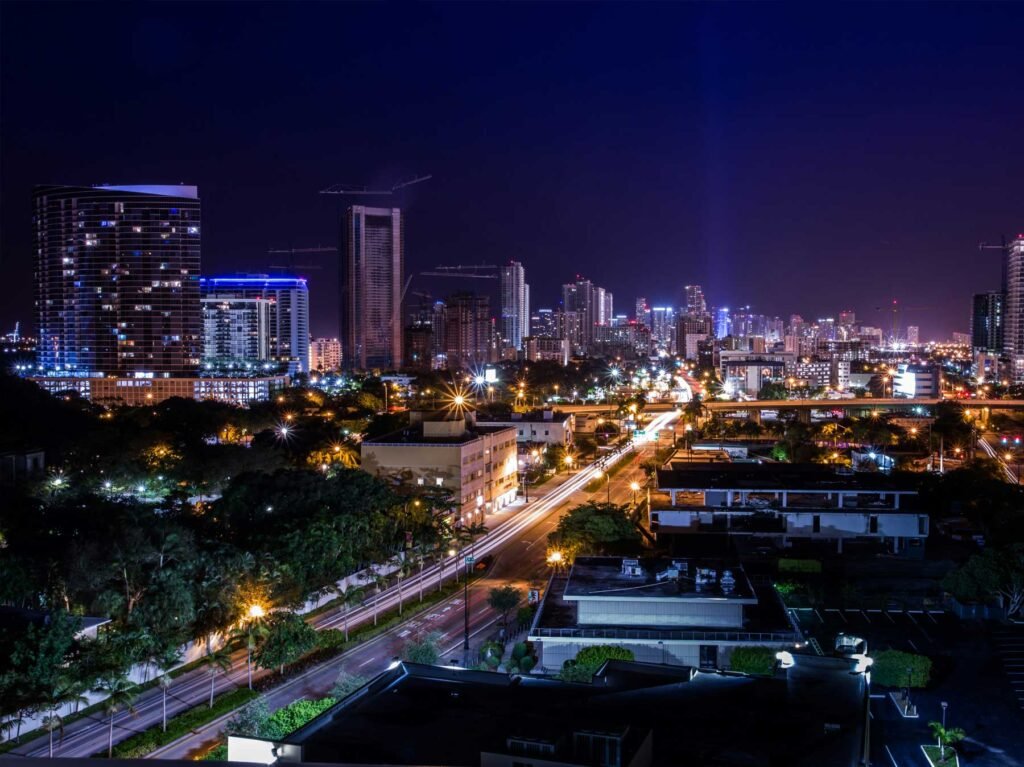
Miami Luxury Condos · The Towers of Quayside
213 residential homes make up The Towers of Quayside.
By Josh Stein · Florida license SL3057661 · Updated 27 October 2026Leer en español →
17 condos for sale at The Towers of Quayside, average list price $315.83 per sq ft (total list price ÷ total sq ft).
- Asking range$210,000 to $1,220,000
- List price per sq ft$315.83
- Months of inventory12.8
- Sold, 12 months16


Listing information is deemed reliable but is not guaranteed and is provided exclusively for consumers' personal, non-commercial use. Data is supplied by the MLS and may be subject to change or withdrawal without notice.
Last updated October 28, 2026, 4:28 pm
Key facts about The Towers of Quayside
| Address | 1000 Quayside Terrace, Miami FL 33138 |
|---|---|
| For sale now | 17 |
| For rent now | 8 |
| Pending | 2 |
| List price range | $210,000 to $1,220,000 |
| Size | 1,200 to 1,913 sq ft |
| Bedrooms | 1 to 3 BR |
| List price per sq ft | Average $315.83, low $137, high $638 |
| Monthly HOA | $653 to $2,808 |
| Year built | 1981 |
| Amenities | Basketball Court, Bike Storage, Business Center, Clubhouse, Elevators, Fitness Center, Maintenance Grounds, Management, Parking, Picnic Area, Pier, Playground, Pool, Racquetball, Sauna, Spa Hot Tub, Tennis Courts |
| Neighborhood | Miami |
Residences at The Towers of Quayside
| Bedrooms | For sale | Size (sq ft) | List price | Avg $/sq ft | Last sale |
|---|---|---|---|---|---|
| 1 | 2 | 1,200 to 1,535 | $210,000 to $310,000 | $190.13 | $250,000 (August 24, 2026) |
| 2 | 13 | 1,268 to 1,538 | $235,000 to $635,000 | $304.20 | $475,000 (July 24, 2026) |
| 3 or more | 2 | 1,538 to 1,913 | $429,000 to $1,220,000 | $477.83 | $735,000 (March 4, 2026) |
Unit lines
| Line | Records | Bedrooms | Size (sq ft) |
|---|---|---|---|
| 02 | 3 | 2 to 3 BR | 1,544 to 1,913 |
| 03 | 3 | 2 BR | 1,312 |
| 04 | 2 | 2 BR | 1,268 to 1,312 |
| 05 | 2 | 2 BR | 1,520 |
| 06 | 6 | 2 BR | 1,520 |
| 07 | 3 | 1 to 2 BR | 1,457 to 1,535 |
| 08 | 5 | 1 to 2 BR | 1,200 |
| 09 | 3 | 2 BR | 1,312 |
| 10 | 4 | 2 BR | 1,312 |
| 11 | 3 | 2 to 3 BR | 1,538 |
The last two digits of the unit number (05 in 305, 405, 505).
Recently sold in
4 listings


Verified 23 September 2026Miami-Dade County Property Appraiser1 source
Building facts
- Address
- 1000 Quayside Terrace
- Neighborhood
- Miami
- Year built
- 1981
- Residences
- 213
- Status
- Delivered — completed 1981
Key Takeaways
- The Towers of Quayside recorded 7 sales in the 12 months to 23 September 2026, at a median of $330,000, or $252 per square foot, on the Miami-Dade County Property Appraiser record. The latest recorded sale was on 2 March 2026. Own at The Towers of Quayside? Ask Josh what yours would sell for on WhatsApp.
- 213 residential homes make up The Towers of Quayside at 1000 Quayside Terrace: every folio in this declaration is a dwelling, with no commercial folios to exclude.
- This is a two-bedroom building above all else: 177 of the 213 homes (83.1%) carry two bedrooms, with 18 one-bedrooms and 18 three-bedrooms making up the rest.
- 2026 produced both the building’s record sale and its lowest median in four years: $735,000 on 2 March against a four-sale median of $237,500. With that few sales, both figures are true and neither is a trend.
- 187 of the 213 homes have a documented round trip: 155 sold for more, 30 for less and 2 at an identical price, a median gain of 76.7% over a median hold of 33.9 years.
- One home in 21 — changes hands here each year, measured across the last four years of qualified sales.
- 2026 assessed values across the 213 homes — range from $68,251 to $672,826, median $247,694.
1000 Quayside Terrace, Miami, Florida 33138 | Neighborhood: Miami
Home > Miami Luxury Condos > The Towers at Quayside
Two Hundred and Thirteen Homes on Quayside Terrace
I pulled every folio the Miami-Dade County Property Appraiser holds for The Towers of Quayside at 1000 Quayside Terrace. The county returns 213 folios and all 213 are residential dwellings — there are no commercial folios, no parking or storage folios and no hotel-declared units sitting inside this declaration to strip out. That makes the count clean: 213 folios, 213 homes.
One detail worth naming, because it would otherwise look like an error. The county files these homes under two spellings of the same subdivision — 212 under Towers of Quayside Condo #1 and a single folio under The Towers of Quayside #1. That is a county typo, not a second building, and I have merged them. If you pull this address yourself and get 212, that missing folio is where it went.
The bed mix is unusually concentrated. 177 of the 213 homes — 83.1% — carry two bedrooms. The remainder splits evenly: 18 one-bedroom homes (8.5%) and 18 three-bedroom homes (8.5%). Heated area runs from 1,200 to 3,225 square feet with a median of 1,520, and the floorplates repeat heavily: 71 homes share a 1,312 sq ft plan, 35 share 1,538 sq ft and 34 share 1,520 sq ft. On the 2026 tax roll, assessed values across the 213 homes run from $68,251 to $672,826, median $247,694.
The county records the year built as 1981. What I do not have is a confirmed story count, architect or amenity list. None of that sits in the county file, and I would rather leave it out than copy it off a listing site.
Why Did 2026 Produce the Highest Sale and the Lowest Median at Once?
| Year | Qualified sales | Median price | Median $/sq ft |
|---|---|---|---|
| 2023 | 14 | $418,500 | $297 |
| 2024 | 15 | $435,000 | $300 |
| 2025 | 8 | $427,500 | $278 |
| 2026 to date | 4 | $237,500 | $181 |
Because four sales is not a market, it is four sales. The 2026 row reads like a collapse — the median falls from $427,500 to $237,500 (down 44%) and the rate per foot from $278 to $181 (down 35%). In the same year, on 2 March, a home here closed at $735,000, which is the highest qualified price on this building’s entire county record going back decades. Both numbers describe 2026. Only four qualified sales have closed, so a single small, low-floor or unrenovated home carries enormous weight in the median, and a single large one carries enormous weight in the maximum.
My honest reading: I would not tell you prices at Quayside have fallen 35 to 44 percent this year, because this record cannot support that claim. What I would tell you is that 2023 and 2024 were the solid years here — 14 and 15 sales, medians $16,500 apart and rate per foot within $3 — and that both 2025 and 2026 have thinned out badly, to 8 sales and then 4. The direction from 2024 into 2025 is probably real and modest: $300 to $278 a foot, on 8 sales, is a soft step down rather than a break. The magnitude of anything after that is genuinely uncertain and I will not put a number on it.
Set against the building’s longer history, the recent window is a sliver. The county carries 738 qualified sales at this address across its full record. Turnover across the last four years works out to one home in 21 each year, which is a normal, liquid rate for a building of this size — the thinness is recent, not structural.
A Thirty-Four-Year Median Hold, and What It Buys
187 of the 213 homes here — 87.8% — have a completed round trip on the county record, meaning the same folio was bought and later resold with both legs qualified, arm’s-length transactions. That is a high coverage rate and it makes the resale record here more informative than the four-year table above.
Of those 187 round trips, 155 sold for more than the previous owner paid, 30 sold for less, and 2 closed at an identical price. So 82.9% gained. The median gain across all 187 is 76.7%; across the 155 that gained, 97.8%. The full range runs from -53.7% to +422.9%.
The number that explains those figures is the hold: a median of 33.9 years. This is a building whose typical documented round trip spans more than three decades between its two legs. A 76.7% median gain over thirty-four years is not a strong appreciation record — it is a slow one, and it is worth saying so plainly rather than quoting the headline percentage and letting it flatter the building. Thirty homes still managed to lose money across that span, one of them by more than half.
The practical consequence is that this building’s resale statistics tell you about the 1990s more than they tell you about the 2020s. If you want to know what a home bought here in 2019 is worth now, the round-trip median will not tell you, and neither will four sales in 2026. The 14 and 15 sale years — 2023 and 2024 — are the most useful comparable set on this page.
Who The Towers of Quayside Suits, and Who It Does Not
It suits a buyer who wants a genuinely large two-bedroom home at a low entry price. The median home here is 1,520 square feet and the median assessed value is $247,694; and 83.1% of the building offers that in the same two-bedroom configuration. Repeated floorplates also mean real comparables: 71 homes share one plan, which puts a buyer in a strong position when arguing price.
It suits badly a buyer who needs the building to appreciate quickly. The documented record here is a 76.7% median gain over a 33.9-year median hold, and 30 of 187 round trips lost money. That is a place to live, not a position to trade, and I would rather say that than dress the number up.
It also suits badly anyone who needs a current comparable this month. Sales have thinned from 15 in 2024 to 8 in 2025 to 4 so far in 2026, and those four range from the building’s all-time record price down to a median of $237,500 — an enormous spread to price against.
If you are selling: price against the 2023 and 2024 rate-per-foot band of $297 to $300, adjusted for your specific floorplate, rather than against either 2026 extreme. One of those four sales set a building record and the others pulled the median to its lowest point in four years; a buyer’s agent will quote whichever one helps them, and your defense is the 29 sales from the two solid years, not the four from this one.
Own at The Towers of Quayside?
If you own here, this page already carries the county’s record of what homes in The Towers of Quayside have sold for. Here is how to use it.
Your three options
- Sell. Price against what comparable homes in the building have actually recorded, not against asking prices.
- Rent it out. Within the condominium’s rental rules, which vary from building to building.
- Hold. Watch the record: this page is updated from the county as new sales are posted.
What I will send you
Tell me your unit. I will send you the recorded sales of comparable homes in The Towers of Quayside, what they sold for per square foot, and a straight read on what yours could sell for today.
Two free things for owners
Prefer email? hello@joshsteinrealtor.com
Josh Stein, Florida real estate sales associate, license SL3057661.How this building compares: the Miami Condo Index ranks buildings by price per square foot and four-year change from the county record, the Miami Resale Record shows how often resales closed below the seller’s price, and the 100 Latest Sales list shows MLS closings as they post. Every building we cover is on the Miami Luxury Condos page.
The Towers of Quayside — Frequently Asked Questions
What have homes at The Towers of Quayside sold for in the last 12 months?
7 sales were recorded on the Miami-Dade County Property Appraiser record in the 12 months to 23 September 2026, at a median of $330,000 ($252 per square foot). The latest recorded sale was on 2 March 2026. These are recorded closings, not asking prices. If you own at The Towers of Quayside and want to know what your home would sell for, message Josh Stein on WhatsApp at (305) 695-8257.
How many homes are in The Towers of Quayside?
The Miami-Dade County Property Appraiser records 213 residential folios at 1000 Quayside Terrace, and all 213 are dwellings — there are no commercial, parking or storage folios inside this declaration. The county files them under two spellings of the same subdivision name; both are the same building.
Are prices rising or falling at The Towers of Quayside?
The most reliable years are 2023 and 2024, at $297 and $300 per square foot on 14 and 15 sales. 2025 stepped down to $278 on 8 sales, which is probably a real if modest softening. 2026 shows $181 on only 4 sales, and that figure is too thin to be read as a trend.
What is the highest price ever paid at The Towers of Quayside?
$735,000, closed 2 March 2026, at $384 per square foot for a 1,913 sq ft home. It is the highest qualified price on the building’s entire county record.
Why is the 2026 median so much lower than 2025?
Only four qualified sales have closed in 2026, so one small or unrenovated home moves the median a long way. The same four sales also contain the highest price ever recorded here. Both facts are true, and neither supports a claim about where prices are going.
How often do homes sell at The Towers of Quayside?
About one home in 21 changes hands each year, measured across the last four years. The county carries 738 qualified sales at this address across its full record, so the recent thinness is a recent condition rather than a permanent one.
Have homes at The Towers of Quayside gained value?
187 of the 213 homes have a documented round trip: 155 sold for more than the previous owner paid, 30 sold for less and 2 closed at an identical price. The median gain is 76.7% — but over a median hold of 33.9 years, which is a slow rate of appreciation rather than a strong one.
What size are the homes at The Towers of Quayside?
1,200 to 3,225 square feet, median 1,520, and 83.1% of the building is two-bedroom. Floorplates repeat heavily — 71 homes share a 1,312 sq ft plan. 2026 assessed values range $68,251 to $672,826, median $247,694.
Sources and further reading
Interested in selling in The Towers of Quayside?
Learn more about selling your condo in The Towers of Quayside with Josh Stein.
Thinking about The Towers of Quayside?
I have sold South Florida property since 2002, more than $1 billion of it. Ask me for the recorded declaration, what has genuinely closed, or a straight answer on whether this building fits what you are after.
Josh Stein · Florida real estate sales associate, license SL3057661 · (305) 695-8257 · hello@joshsteinrealtor.comRelated coverage
Part of Miami Luxury Condos.