

Miami Luxury Condos · Sunny Isles Beach · Mansions at Acqualina
82 of the 84 homes here are the identical 4,609 square feet.
By Josh Stein · Florida license SL3057661 · Updated 30 September 2026
Verified 3 August 2026Miami-Dade County Property Appraiser1 source
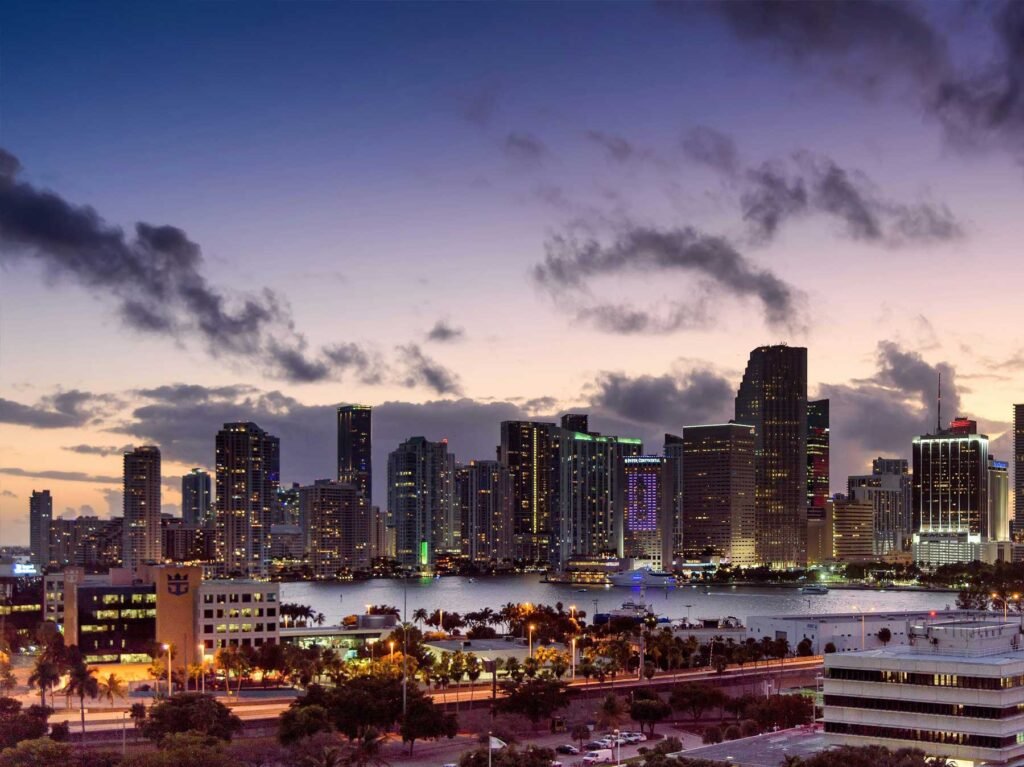
Mansions at Acqualina — photography to follow
Building facts
- Address
- 17749 Collins Avenue
- Neighborhood
- Sunny Isles Beach
- Year built
- 2015
- Floors
- 47
- Residences
- 84
- Status
- Delivered — completed 2015
Mansions at Acqualina completed in 2015 — 47 storeys, 643 feet, by the Trump Group, architecture by Cohen Freedman Encinosa. Residences start at 4,600 square feet; penthouses run 9,000 to 12,000. Recent trade: unit 902 at $6.925 million, $1,502 per square foot, August 2025. The residence count is genuinely disputed: 79 (developer-sourced), 72 (reported at completion), and 86 recorded in the Declaration of Condominium with 14 of those noted as forming a single facility. The 86 figure is the legal record. Verify before relying on any of them. Also note: the 2026 defect litigation against the Trump Group concerns Estates at Acqualina at 17901 and 17975 Collins — a different, newer building. Neither Mansions nor Acqualina Resort & Residences is a defendant.
Verified 3 August 2026. Source: The Real Deal, 18 Aug 2015 and The Real Deal, 26 Mar 2026
Key Takeaways
- Mansions at Acqualina recorded 3 sales in the 12 months to 23 September 2026 — at a median of $7,200,000, or $1,562 per square foot, on the Miami-Dade County Property Appraiser record. The latest recorded sale was on 30 June 2026. Own at Mansions at Acqualina? Ask Josh what yours would sell for on WhatsApp.
- 82 of the 84 homes here are the identical 4,609 square feet. — The other two are 9,218 — each a pair of top-floor units recorded under one folio. This is the most uniform building in this hub, and it makes every sale a direct comparable.
- Because size is constant, the spread between identical homes is the whole story: — in 2023 four 4,609 sq ft homes traded between $1,302 and $1,649 per square foot — 27% apart. Floor, view and finish set price here, not footage.
- 2026 has one sale, and it is the highest rate ever paid in the building: — $13,300,000 for unit 3901 on 16 April 2026 — $2,886 per square foot. One sale is not a market, and this page does not treat it as one.
- One home in 24 changes hands each year. — Fourteen qualified sales across four years against 84 homes — among the least liquid buildings measured on this site.
- 12 of 41 completed round trips lost money — 29.3%, — against a median gain of just 7.7% over a median 5.6-year hold. 66 of the building’s 108 qualified sales closed in 2015, at delivery.
- The record price is $16,000,000, 29 April 2016, — for units 4401 and 4402 bought together on one deed — 9,218 square feet, $1,736 per square foot.
Mansions at Acqualina, by the numbers
Source: the building record on this site.
17749 Collins Avenue, Sunny Isles Beach, Florida 33160 | Neighborhood: Sunny Isles Beach
Eighty-Four Homes, and Eighty-Two of Them Are the Same
I pulled all 85 folios the Miami-Dade County Property Appraiser holds for the 17749 Collins Avenue Condo declaration. One is the reference folio, leaving 84 residential homes, and the declaration’s undivided common-element shares close complete. No commercial, hotel, parking, cabana or storage folio exists inside it.
Then the number that makes this building unusual. 82 of the 84 homes are 4,609 square feet. Exactly 4,609 — not approximately. The remaining two are 9,218 square feet, which is precisely double, and the county’s legal descriptions say why: folio 31-2211-083-0370 is units 4101 & 4102 and folio 31-2211-083-0400 is units 4401 & 4402, each a pair of top-floor homes recorded under a single folio.
I have measured a lot of Miami buildings on this site and I have not found another this uniform. Most towers give you five or six dominant floorplates and a long tail; this one gives you one plan, repeated eighty-two times. Everything else on this page follows from that.
On the 2026 tax roll the 84 homes are assessed between $4,075,338 and $11,943,000, median $5,563,320 — a spread of under three to one in a building where the largest home is twice the smallest, which is about as tight as an assessment range gets.
Bedroom counts are recorded for 76 of the 84 homes: 64 three-bedrooms, 10 four-bedrooms and the 2 six-bedroom combined homes. The other eight carry a zero or a low number that does not match the floorplate, which is a gap in the county’s file rather than a smaller home, so I have not built anything on it.
Storey count, architect, amenity detail and completion year are not in the property record and I have not filled them in from elsewhere. What the sale file does show is that 66 of this building’s 108 qualified sales closed in 2015, which is when it delivered.
The Price Record, and the Two Deeds That Distort It
| Year | Qualified sales | Median price | Median $/sq ft |
|---|---|---|---|
| 2023 | 4 | $6,675,000 | $1,448 |
| 2024 | 5 | $6,900,000 | $1,497 |
| 2025 | 4 | $6,862,500 | $1,489 |
| 2026 to date | 1 | $13,300,000 | $2,886 |
Two of those rows need a warning label, and I would rather give them to you than let the table speak for itself.
First, 2023 contains the same home twice. Unit 2502 recorded two qualified deeds on the same day, 12 October 2023 — one at $7,600,000 and one at $7,100,000. Both carry the county’s qualified flag; both are on the file. That is a back-to-back conveyance, not two arm’s-length sales, and it means a four-sale year is really three trades. Remove either deed and 2023’s median price per square foot falls from $1,448 to $1,356 — a 6.8% swing produced by a bookkeeping artefact. I have left the table as the county records it and I am telling you what it does.
Second, 2026 is one sale. On 16 April 2026, unit 3901 sold for $13,300,000 — $2,886 per square foot on the same 4,609 sq ft plan as eighty-one other homes, and the highest rate ever recorded in this building by a wide margin. It is a real, single-unit, arm’s-length deed, and the same home sold for $7,109,800 in October 2015, so its own eleven-year round trip is +87%. But one sale is not a market, and any page that shows you 2026 at $2,886 without that sentence attached is selling you something.
Strip both distortions and the honest reading of the last four years is: this building has traded in a band of roughly $1,300 to $1,650 per square foot since 2023, with no clear direction, and one 2026 trade well above it that may be the start of something or may be a single buyer paying for a specific apartment. Fourteen qualified sales across four years against 84 homes is one home in 24 each year — among the least liquid buildings I have measured. At that volume the record cannot establish a trend, and I am not going to invent one.
The four-year median is $6,912,500 and $1,500 per square foot. The record price is $16,000,000 on 29 April 2016 — units 4401 and 4402 bought together on one deed, 9,218 square feet, $1,736 per square foot.
One more figure that deserves attention: 41 homes here have a completed round trip and 12 of them, 29.3%, resold for less than the previous owner paid, with a median gain across all 41 of just 7.7% over a median 5.6-year hold. For a building of this price and vintage that is a thin result, and it is the number I would put in front of anyone treating this address as an investment rather than a home.
What Can You Learn From a Building Where Every Home Is the Same Size?
Something you cannot learn anywhere else in this hub: what a floor and a view are actually worth, with square footage held constant.
In every other building, when two homes sell at different rates per foot you can never fully separate the premium from the plan. Here you can. Eighty-two homes, one size. Every sale is a controlled comparison against every other sale.
And the answer is that the spread is large. In 2023, four sales of the identical 4,609 sq ft home ran from $1,302 to $1,649 per square foot — 27% apart. In 2025, four more ran $1,323 to $1,649 — 25% apart. Only 2024 was tight, five sales inside a 9% range. Then April 2026 at $2,886.
Twenty-five to twenty-seven per cent, on homes that are dimensionally identical, in the same year, in the same tower. That is the size of the premium for floor, exposure, view and condition in this building, and it is far larger than most buyers assume. It also means the building median is a weak guide to any individual apartment: the median is answering a question about the middle of the stack, and almost no home is in the middle of the stack.
The practical consequence is simple. When you are shown a comparable here, the only question that matters is which floor and which exposure. A same-size comparable is guaranteed; a same-value comparable is not.
Who This Building Suits, and Who It Suits Badly
It suits a buyer who wants a very large oceanfront home and does not want to negotiate over floorplans. Every home is 4,609 square feet; the decision reduces to floor, exposure and price, which is a genuinely easier purchase than most. It suits a buyer who values a tight, legible building — 84 homes, one plan, an assessment range under three to one — where the record is small enough to read in full.
It suits badly a buyer who needs liquidity or a read on direction. One home in 24 trades each year, and the four-year record is fourteen sales, two of which are the same apartment on the same day. That is not enough to tell you where prices are going, and I would rather say so than fill four rows with confidence.
It suits badly, too, anyone underwriting appreciation. 29.3% of completed round trips here have lost money and the median gain across all of them is 7.7% over more than five years. The building delivered in 2015 into a strong market and much of the record since is people getting out at close to what they paid.
If you are selling here, your comparable set is unusually clean and you should use it aggressively: every other sale in the building is the same size as yours, so the entire argument is floor and view. Establish where in that 25% band your apartment sits and defend it. And if a buyer’s agent quotes you the 2026 print at $2,886 as the new normal, or the 2023 median as evidence of a trend, both are single-deed artefacts — the first is one sale, the second contains one apartment twice.
The Mansions at Acqualina — Frequently Asked Questions
What have homes at Mansions at Acqualina sold for in the last 12 months?
3 sales were recorded on the Miami-Dade County Property Appraiser record in the 12 months to 23 September 2026, at a median of $7,200,000 ($1,562 per square foot). The latest recorded sale was on 30 June 2026. These are recorded closings, not asking prices. If you own at Mansions at Acqualina and want to know what your home would sell for, message Josh Stein on WhatsApp at (305) 695-8257.
How many residences are at The Mansions at Acqualina?
The Miami-Dade County Property Appraiser carries 84 residential homes in this declaration as of 24 August 2026, and the declaration closes complete. 82 of them are 4,609 square feet — the identical floorplate. The remaining two are 9,218 square feet, each a pair of top-floor units (4101 & 4102, and 4401 & 4402) recorded under a single folio.
What do homes sell for here?
Across the last four years, 14 qualified sales produced a median of $6,912,500 and a median of $1,500 per square foot. Setting aside a single April 2026 trade at $2,886 per square foot, the building has traded in a band of roughly $1,300 to $1,650 per square foot since 2023. 2026 is an incomplete year and rests on one sale.
Are prices rising at The Mansions at Acqualina?
The record cannot tell you. Fourteen qualified sales in four years — four, five, four and one — is not enough volume to establish a direction, and two of those fourteen are the same apartment conveyed twice on the same day. The 2023, 2024 and 2025 medians per square foot sit within about 3.5% of each other. Anyone quoting you a four-year trend here is quoting arithmetic, not evidence.
What was the $13.3 million sale in 2026?
Unit 3901, on 16 April 2026 — $13,300,000 for 4,609 square feet, or $2,886 per square foot, the highest rate ever recorded in this building. It is a genuine single-unit arm’s-length deed, and the same home sold for $7,109,800 in October 2015. It is also the only sale of 2026 so far, so it should be read as one data point rather than as a new price level.
What is the highest price ever paid in the building?
$16,000,000 on 29 April 2016, for units 4401 and 4402 purchased together on a single deed — 9,218 square feet, $1,736 per square foot.
Why do identical apartments here sell at such different prices?
Because with size held constant, floor and view are the entire premium — and it is larger than most buyers expect. In 2023 four sales of the identical 4,609 sq ft home ranged from $1,302 to $1,649 per square foot, 27% apart. In 2025 four more ranged $1,323 to $1,649, 25% apart. When you are shown a comparable here, the only questions that matter are which floor and which exposure.
Have owners made money here?
Less than you might expect at this price level. Of 41 completed round trips on the county record, 12 — 29.3% — resold for less than the previous owner paid, and the median gain across all 41 is 7.7% over a median 5.6-year hold. 66 of the building’s 108 qualified sales closed in 2015, when it delivered.
Sources and further reading
Interested in selling at Mansions at Acqualina?
Learn more about selling your condo at Mansions at Acqualina with Josh Stein.
Amenities at Mansions at Acqualina
Coming Soon
FAQ’s
Coming Soon
Thinking about Mansions at Acqualina?
I have sold South Florida property since 2002, more than $1 billion of it. Ask me for the recorded declaration, what has genuinely closed, or a straight answer on whether this building fits what you are after.
Josh Stein · Florida real estate sales associate, license SL3057661 · (305) 695-8257 · hello@joshsteinrealtor.comGet this building’s next recorded sale — before the listing sites catch up
- Every closed sale we can verify from the Miami-Dade record — price, date, and $/sqft when the deed supports it — not an IDX feed.
- Optional alert when a new deed posts in this building (or a short list of comps you choose).
- No spam inventory blasts. One building. One record. You decide what happens next.
Tell Josh which building. He’ll send the latest closed sales and set a quiet alert.
Get the sales recordRelated coverage
Part of Miami Luxury Condos.