

Miami Luxury Condos · Brickell · Echo Brickell
The most expensive home ever sold in Brickell is in this building.
By Josh Stein · Florida license SL3057661 · Updated 7 September 2026
Verified 3 August 2026Miami-Dade County Property Appraiser1 source
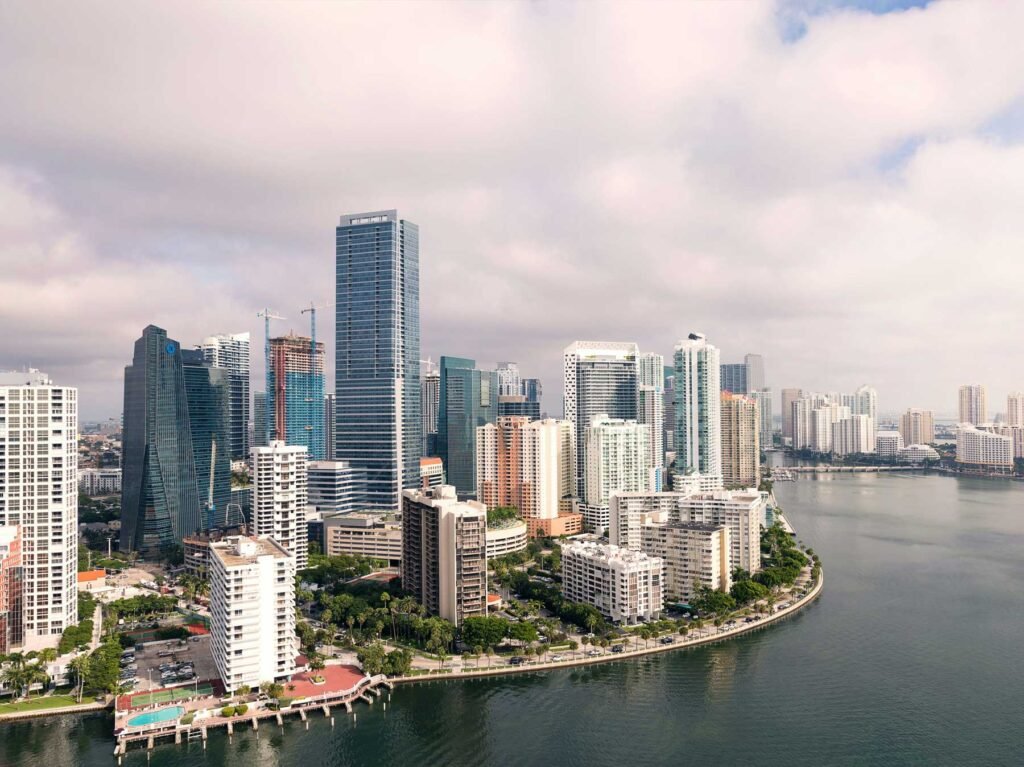
Echo Brickell — photography to follow
Key Takeaways
- The most expensive home ever sold in Brickell is in this building — $33,000,000 in October 2024 for the 7,773 square foot penthouse — $4,245 per square foot, and more than twice the next highest price in the neighbourhood.
- And a third of the buyers below it have not made money — of 103 completed round trips, 35 sold at a loss — a median outcome of just +5.6% over 4.5 years.
- What you paid in 2017 decided almost everything — the cheapest quarter of entries returned a median of +30.0%; the dearest quarter returned −9.2%, with 60.7% of them selling at a loss.
- The worst outcome on record is −44.3% — a 1,614 square foot home bought for $2,782,100 in December 2017 and sold for $1,550,000 in July 2020.
- Selling into the strong market did not fix it — of the 93 owners who sold in 2021 or later, 29.0% still went out below what they paid.
- The 2017 sell-out was expensive — 178 homes first sold at a median of $945,000 and $924 per square foot — and the building has traded near $1,050 per square foot since 2023.
Echo Brickell, by the numbers
Developer: Property Markets Group, JDS Development Group · Architect: Carlos Ott. Source: the building record on this site.
1451 Brickell Avenue, Brickell, Florida 33131 | Neighborhood: Brickell
What is actually inside the building
The Miami-Dade County Property Appraiser holds 174 folios for Echo Brickell at 1451 Brickell Avenue, of which 171 are homes. The other three are two ground-floor commercial units and an aggregate reference folio, and all three are excluded from every figure below. The declaration’s common-element shares close at 100.4340% — above the whole rather than short of it, which means nothing is missing from this pull.
The homes run 690 to 7,773 square feet, with a median of 1,148. The mix is 94 two-bedrooms and 53 one-bedrooms, with thirteen three-bedrooms, ten four-bedrooms and one six-bedroom.
Three floorplates cover 51 of the 171 — 1,287 square feet, 777 and 1,137, seventeen of each — and above them the building thins out quickly into plates that appear three to six times.
The 2026 assessed values run $286,108 to $25,825,790, with a median of $983,112. That maximum is one apartment, and it is the reason this page needs two separate sections.
The penthouse and everyone else
On 18 October 2024 the 7,773 square foot penthouse here sold for $33,000,000 — $4,245 per square foot. Of the 31 Brickell buildings I have pulled the county record for, that is the highest price anything has ever sold for, and it is not close: the next highest anywhere in the cluster is $14,000,000. It is not, for what it is worth, a Miami record — several oceanfront buildings have traded higher per square foot — but within Brickell nothing comes near it.
Now the rest of the building, which is a very different page.
One hundred and seventy-eight homes recorded a first qualified sale between 2017 and 2019, at a median of $945,000 and $924 per square foot. By the standards of Brickell in 2017 that was an expensive opening, and it is the number every outcome here is measured against.
One hundred and three of those buyers have since sold. Sixty-eight gained and 35 lost — a 34.0% loss rate — at a median of +5.6% over a median holding period of 4.5 years. Sixty-eight homes have never resold.
Timing does not explain it. Ninety-three of the 103 sold in 2021 or later, through the strongest stretch Miami has had, and 29.0% of them still sold below what they paid, at a median of +7.2%.
The entry price does explain it. Sorted by what each buyer paid per square foot in the sell-out:
| Sell-out entry price | Round trips | Sold at a loss | Median outcome |
|---|---|---|---|
| $567–$748 per sq ft | 25 | 20.0% | +30.0% |
| $752–$901 | 25 | 12.0% | +12.5% |
| $912–$1,101 | 25 | 40.0% | +2.9% |
| $1,109–$1,889 | 28 | 60.7% | −9.2% |
A majority of the buyers who paid above about $1,100 per square foot in 2017 have sold at a loss, and the group as a whole is down. The buyers who came in below $750 are up 30%. Same building, same seven-year window.
By floorplate the same thing shows up at the larger sizes: of the five 1,625 square foot homes with a completed round trip, four sold at a loss, at a median of −12.0%.
The extremes:
- A 1,287 square foot home bought for $755,900 in November 2017 sold for $1,450,000 in July 2022 — up 91.8%.
- A 1,614 square foot home bought for $2,782,100 in December 2017 sold for $1,550,000 in July 2020 — down 44.3%.
That second buyer paid $1,724 per square foot in 2017. The first paid $587. The county record shows transactions and not reasons — it cannot say why anyone agreed either number — but it establishes plainly that in this building the developer’s price varied enormously by home, and that variation, not the market, is what separated the outcomes. All figures are gross, before commissions, closing costs, taxes and assessments.
The price record
Qualified, arm’s-length sales from the county record, retrieved 21 August 2026.
| Year | Qualified sales | Median price | Median $/sq ft |
|---|---|---|---|
| 2023 | 12 | $920,000 | $1,045 |
| 2024 | 15 | $1,225,000 | $1,149 |
| 2025 | 7 | $1,218,000 | $1,075 |
| 2026 to date | 4 | $1,122,500 | $1,004 |
Thirty-eight qualified sales in four years across 171 homes is about one home in eighteen each year.
Per square foot the four years run $1,045, $1,149, $1,075 and $1,004 — a drift of −4.0% across the period. On 38 sales I would call that flat rather than falling; the direction is not supportable at this sample size and I am not going to claim it.
What is worth stating is the relationship between that band and the sell-out. The building opened at a median of $924 per square foot in 2017 and has traded around $1,050 since 2023. Nine years, roughly 14% on the median rate, before any cost of ownership. That is the plain arithmetic behind a 34% loss rate, and it is more informative than any single sale.
The $33,000,000 penthouse sits entirely outside that band at $4,245 per square foot and should not be read as evidence about anything else in the building.
Who this building suits
It suits a buyer who is buying a specific apartment on evidence and is prepared to be unsentimental about price. The single most useful fact here is that the 2017 developer price varied from under $600 to nearly $1,900 per square foot across the same building, and that variation has driven every outcome since. Establish what the seller paid before you discuss anything else.
It suits a buyer at the lower end of the building better than the upper. The cheapest quarter of 2017 entries is up 30.0% with a 20% loss rate; the dearest quarter is down 9.2% with a 60.7% loss rate. Nothing in the record suggests that has reversed.
It suits a buyer expecting appreciation from a new Brickell tower badly, and this building is one of the clearer cautionary records available. A third of everyone who has bought and sold here lost money, most of them selling into a rising market.
It suits someone who wants the address and the apartment for their own sake. A median home of 1,148 square feet on Brickell Avenue, assessed at a median of $983,112, is a perfectly sound proposition — provided it is bought at a price the resale record supports rather than at the 2017 one.
If you are selling here, the first thing a prepared buyer will look up is what you paid in 2017, and there is a good chance it was high. If you were in the lower half of the sell-out range, the record is genuinely with you and you should show it. If you were not, price against the current per-foot band of roughly $1,000 to $1,150 rather than against your entry, because 35 owners before you have already tested the alternative. Ask me for the per-foot record on your line before you set a number.
Echo Brickell — Frequently Asked Questions
What is the most expensive home ever sold in Brickell?
On the county record, the 7,773 square foot penthouse at Echo Brickell — $33,000,000 on 18 October 2024, or $4,245 per square foot. Across the 31 Brickell buildings whose full county record has been pulled on this site, the next highest price anywhere is $14,000,000. It is not a Miami-wide record: several oceanfront buildings have traded higher per square foot.
Have owners at Echo Brickell made money?
A third of them have not. Of 103 completed round trips, 68 gained and 35 lost — a 34.0% loss rate — at a median of just +5.6% over a median holding period of 4.5 years. And 93 of those 103 sold in 2021 or later, into a strong market, where 29.0% still went out below what they paid.
Which buyers at Echo Brickell did worst?
The ones who paid most in the 2017 sell-out. Sorted by entry price per square foot, the cheapest quarter returned a median of +30.0% with a 20.0% loss rate; the dearest quarter returned −9.2% with 60.7% selling at a loss. The developer’s 2017 price ranged from under $600 to nearly $1,900 per square foot inside the same building.
What is the worst loss recorded at Echo Brickell?
A 1,614 square foot home bought for $2,782,100 in December 2017 and sold for $1,550,000 in July 2020 — down 44.3%. That buyer paid $1,724 per square foot at the sell-out. By floorplate, four of the five 1,625 square foot homes with a completed round trip sold at a loss.
What does a home at Echo Brickell cost per square foot?
Between roughly $1,000 and $1,150 since 2023: medians of $1,045 in 2023, $1,149 in 2024, $1,075 in 2025 and $1,004 in 2026 to date. On 38 sales across four years I would read that as flat rather than falling.
How does that compare with the 2017 sell-out?
The building opened at a median of $924 per square foot and has traded near $1,050 since 2023 — roughly 14% on the median rate across nine years, before any cost of ownership. That arithmetic is the reason a third of resales here have been losses.
How big are the homes at Echo Brickell?
From 690 to 7,773 square feet, with a median of 1,148. Ninety-four are two-bedrooms and 53 one-bedrooms, with thirteen three-bedrooms, ten four-bedrooms and one six-bedroom. Three floorplates cover 51 of the 171 homes: 1,287 square feet, 777 and 1,137, seventeen of each. The 2026 assessed values run $286,108 to $25,825,790, median $983,112.
Sources and further reading
Echo Brickell completed in 2017 — 57 storeys, 180 residences by PMG with JDS Development Group, designed by Carlos Ott with Yoo Studio. Boutique floor plates by Brickell standards. The duplex penthouse — 11,000 square feet with an indoor sky pool and 28-foot ceilings — sold for $33 million ($2,982 per square foot) in October 2024, a Brickell record at the time. No litigation or special assessment reported for 2025 or 2026.
Verified 3 August 2026. Source: The Real Deal, 23 Oct 2024
Interested in selling in Echo Brickell?
Learn more about selling your condo in Echo Brickell with Josh Stein.
Thinking about Echo Brickell?
I have sold South Florida property since 2002, more than $1 billion of it. Ask me for the recorded declaration, what has genuinely closed, or a straight answer on whether this building fits what you are after.
Josh Stein · Florida real estate sales associate, license SL3057661 · (305) 695-8257 · hello@joshsteinrealtor.comGet this building’s next recorded sale — before the listing sites catch up
- Every closed sale we can verify from the Miami-Dade record — price, date, and $/sqft when the deed supports it — not an IDX feed.
- Optional alert when a new deed posts in this building (or a short list of comps you choose).
- No spam inventory blasts. One building. One record. You decide what happens next.
Tell Josh which building. He’ll send the latest closed sales and set a quiet alert.
Get the sales recordRelated coverage
Part of Miami Luxury Condos.