

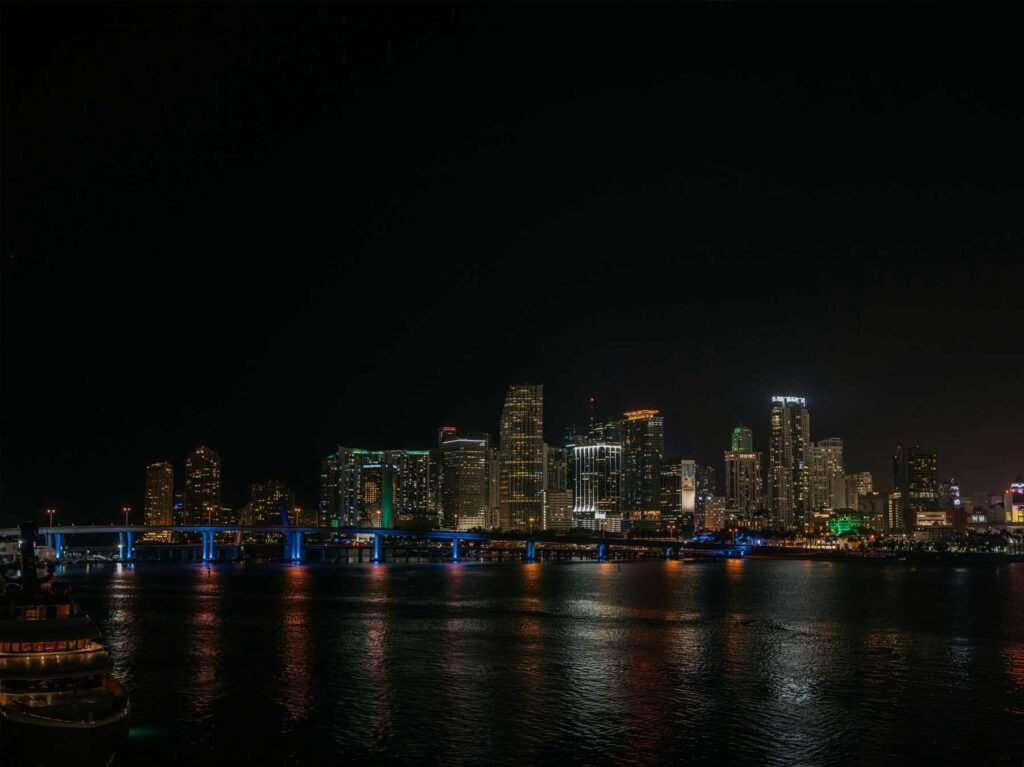
Building facts
- Address
- 17475 Collins Avenue
- Neighborhood
- Sunny Isles Beach
- Year built
- 2015
- Floors
- 33
- Residences
- 81
- Status
- Completed
- Developer
- Chateau Group
- Architect
- Kobi Karp
- Pricing
- Starting at $3.689 Million
Key Takeaways
- One home here sold twice in two days, and the first price is not a market price — unit 1803 changed hands on 7 April 2026 at $1,220,000 and again on 8 April 2026 at $2,100,000. The county flags both as qualified. The first leg reads as $589 per square foot against a building that otherwise trades between $1,014 and $1,829. It is excluded from every figure here and disclosed rather than quietly dropped.
- Excluding it, the four-year change is +1.3% — and still not published — because with that transfer removed 2026 carries four qualified sales, below the five I require at both ends. Including it the arithmetic gives −5.0%. I would rather show you both numbers and publish neither.
- Nearly 43% of the original buyers who resold lost money — 15 of 35, at a median gain of just 2.0%. The building sold out in 2015 at a median $2,700,000, or $977 per square foot.
- There is no cheap stock here at all — the county assesses the least valuable home in the building at $1,261,077. The median home is 2,703 sq ft and 14 of the 81 homes are four-bedrooms.
- The record is $14,850,000 — paid on 14 August 2025 for the 8,117 sq ft home on the 24th floor, at $1,829 per square foot. The same home sold for $13,000,000 in December 2021 — a gain of 14.2% in three and a half years.
- One home in 18 changes hands each year — better than the median of one in 24 across the buildings in my Miami Condo Index.
17475 Collins Avenue, Sunny Isles Beach, Florida 33160 | Neighborhood: Sunny Isles Beach
What is actually in the building
The county returns 82 folios for 17475 Collins Avenue. 81 are homes; the remaining one is a reference folio carrying no dwelling. There is no separately filed parking, cabana or storage stock and no commercial folio.
The homes run from 1,465 sq ft to 9,051 sq ft, median 2,703, and the mix is unusually top-heavy: 46 two-bedrooms, 21 three-bedrooms and 14 four-bedrooms, with no one-bedrooms or studios. Even the two-bedrooms are large — the most common floorplan in the building, with 14 homes, is 2,703 sq ft.
The clearest single statement about this address is in the tax roll. For 2026 the county assesses the homes between $1,261,077 and $11,637,108, median $2,683,109. There is no entry tier here. The least valuable home in the building, on the county’s own numbers, is assessed above $1.25m.
What happens when the same home sells twice in two days?
It distorts everything downstream, and it is worth walking through because this is the single most common way condo price data goes wrong.
Unit 1803, a 2,070 sq ft two-bedroom, appears twice on the county record in April 2026. On the 7th it sold for $1,220,000. On the 8th it sold for $2,100,000. Both transactions carry the county’s qualified flag, which is supposed to mean an arm’s-length sale at a market price.
They cannot both be that. The second, at $1,014 per square foot, sits inside the range this building trades in. The first, at $589 per square foot, is 42% below it and below anything else recorded here in four years. I am not going to speculate about what the first transfer was — the county records transactions, not reasons — but I am confident it is not evidence of what a home at this address is worth.
So it is excluded from every figure on this page, and I am telling you that rather than letting it disappear. Here is what the choice is worth:
| Including the 7 April transfer | Excluding it | |
|---|---|---|
| 2026 qualified sales | 5 | 4 |
| 2026 median $/sq ft | $1,160 | $1,237 |
| Four-year change from 2023 | −5.0% | +1.3% |
| Bottom of the four-year band | $589 | $1,014 |
One transaction, and the building reads as falling 5% or rising 1% depending entirely on whether you noticed. Neither figure is published in my Miami Condo Index, and the reason is the honest one: once the transfer is removed, 2026 carries four qualified sales, and I publish a four-year change only where both 2023 and 2026 rest on at least five. The building carries a dash.
The practical lesson generalises well beyond this address. A qualified flag on a deed is a county classification, not a guarantee. Any sale that sits far outside a building’s own band deserves to be checked before it is used, in either direction — and if someone shows you a $589 per square foot comparable at Chateau Beach, the answer is that the same home sold for $1,014 the following day.
The price record
| Year | Qualified sales | Median price | Median $/sq ft |
|---|---|---|---|
| 2023 | 5 | $3,300,000 | $1,221 |
| 2024 | 3 | $3,175,000 | $1,132 |
| 2025 | 5 | $4,500,000 | $1,347 |
| 2026 to date | 4 | $3,250,000 | $1,237 |
The 2026 row excludes the 7 April transfer discussed above. On these figures the building has traded in a fairly narrow per-foot range for four years — $1,132 to $1,347 at the yearly medians — with no direction I would be willing to defend on samples of three to five.
Across the seventeen clean sales in the window the building cleared a median $1,221 per square foot, in a band from $1,014 to $1,829, at a median price of $3,450,000. Liquidity is decent: one home in 18 a year, against a median of one in 24 across the buildings in my Miami Condo Index.
The record is $14,850,000, paid on 14 August 2025 for the 8,117 sq ft home on the 24th floor — $1,829 per square foot, which is also the highest per-foot price the building has achieved. That home last sold on 29 December 2021 for $13,000,000, so its owner realised 14.2% across three and a half years.
The ownership record is the part a buyer should weigh most carefully. This building sold through in 2015 — 60 homes, 74.1% of the building, at a median $2,700,000 or $977 per square foot. Of those original buyers, 35 have since resold and 15 lost money: 42.9%, at a median gain of just 2.0%. Across all 61 resales the county records here, 20 lost money, or 32.8%, at a median gain of 11.6% over a 5.1-year hold.
That is a poor decade for people who bought at the launch, and it is the strongest evidence on this page. It is also, on the numbers above, a story about the entry price in 2015 rather than about the building today: the same stock now clears around $1,237 per square foot against $977 at sell-out.
Who this building suits, and who it does not
It suits a buyer who wants a large oceanfront home in Sunny Isles Beach and is buying at today’s prices rather than inheriting a 2015 basis. Nothing here is small, the four-bedroom count is high for a building of 81 homes, and it trades often enough — one in 18 — that comparables exist.
It suits badly anyone hoping to repeat the 2015 experience. Nearly 43% of that cohort who sold did so at a loss, and the median among them made 2.0% across roughly a decade.
It suits badly a buyer who wants a modest entry into the building. There is not one; the cheapest home by the county’s assessment is above $1.25m.
If you are selling here, know the 7 April 2026 transfer exists before a buyer’s agent finds it. At $589 per square foot it is the lowest number attached to this building in four years, it will be quoted at you, and the complete answer is that the same home sold at $1,014 the next day and that the building’s genuine band starts there. Beyond that, the useful comparables are the four clean 2026 sales at $1,014 to $1,319 per square foot and the 2025 run at $1,195 to $1,829 — and if your home is one of the fourteen four-bedrooms, the August 2025 sale at $1,829 is the ceiling worth arguing from.
Verified 18 August 2026 against the Miami-Dade County Property Appraiser record for 17475 Collins Ave — all 82 folios retrieved individually, grouped by subdivision and filtered to residential homes, excluding one reference folio along with parking, cabana and storage. Sale figures are qualified, arm’s-length transactions only, with bulk/portfolio transfers collapsed to a single transaction. One further transaction is excluded and disclosed: unit 1803 sold on 7 April 2026 for $1,220,000 and again on 8 April 2026 for $2,100,000, and the first leg — $589 per square foot against a building band of $1,014 to $1,829 — is not treated as a market price. With it excluded 2026 carries four qualified sales, below the five required at both ends, so no four-year change is published. 2026 is an incomplete year. Assessed values are the county’s, not market valuations. Building age, storey count, architect and amenity detail are omitted: no primary source has been confirmed for them. Re-check when the next tax roll publishes.
Chateau Beach Residences — Frequently Asked Questions
How much does a home at Chateau Beach Residences sell for?
Across the seventeen clean qualified sales in the four years to August 2026 the building cleared a median $1,221 per square foot, in a band from $1,014 to $1,829, at a median price of $3,450,000. The yearly medians have run between $1,132 and $1,347 per square foot with no clear direction.
Why was one home sold twice in two days?
I cannot tell you why — the county records transactions, not reasons. What it records is that unit 1803, 2,070 sq ft, sold for $1,220,000 on 7 April 2026 and for $2,100,000 on 8 April 2026, with both deeds carrying the qualified flag. The first works out at $589 per square foot, 42% below anything else recorded here in four years, so it is excluded from every figure on this page and disclosed rather than dropped silently.
Have prices at Chateau Beach gone up or down?
No four-year change is published and the building carries a dash in my Miami Condo Index. Including the 7 April 2026 transfer the arithmetic gives −5.0%; excluding it, +1.3%. Once it is excluded 2026 carries four qualified sales, below the five I require at both ends, so neither figure is published.
How big are the homes at Chateau Beach Residences?
From 1,465 sq ft to 9,051 sq ft, median 2,703, with no one-bedrooms or studios. The mix is 46 two-bedrooms, 21 three-bedrooms and 14 four-bedrooms. The most common floorplan, with 14 homes, is 2,703 sq ft.
What is the highest price ever paid at Chateau Beach Residences?
$14,850,000, on 14 August 2025, for the 8,117 sq ft home on the 24th floor — $1,829 per square foot, which is also the building’s highest per-foot price. The same home sold for $13,000,000 on 29 December 2021, a gain of 14.2%.
Have owners at Chateau Beach made money?
Many have not. The building sold through in 2015 at a median $2,700,000, or $977 per square foot. Of those original buyers, 35 have since resold and 15 lost money — 42.9% — at a median gain of 2.0%. Across all 61 resales the county records, 20 lost money, or 32.8%, at a median gain of 11.6% over a 5.1-year hold.
How often do homes at Chateau Beach change hands?
The county records 18 qualified sales in the four years to August 2026 against 81 homes — about one home in 18 a year, better than the median of one in 24 across the buildings in my Miami Condo Index.
Sources and further reading
Interested in selling at Chateau Beach Residences?
Learn more about selling your condo at Chateau Beach Residences with Josh Stein.
Related coverage
Part of Miami Luxury Condos.