

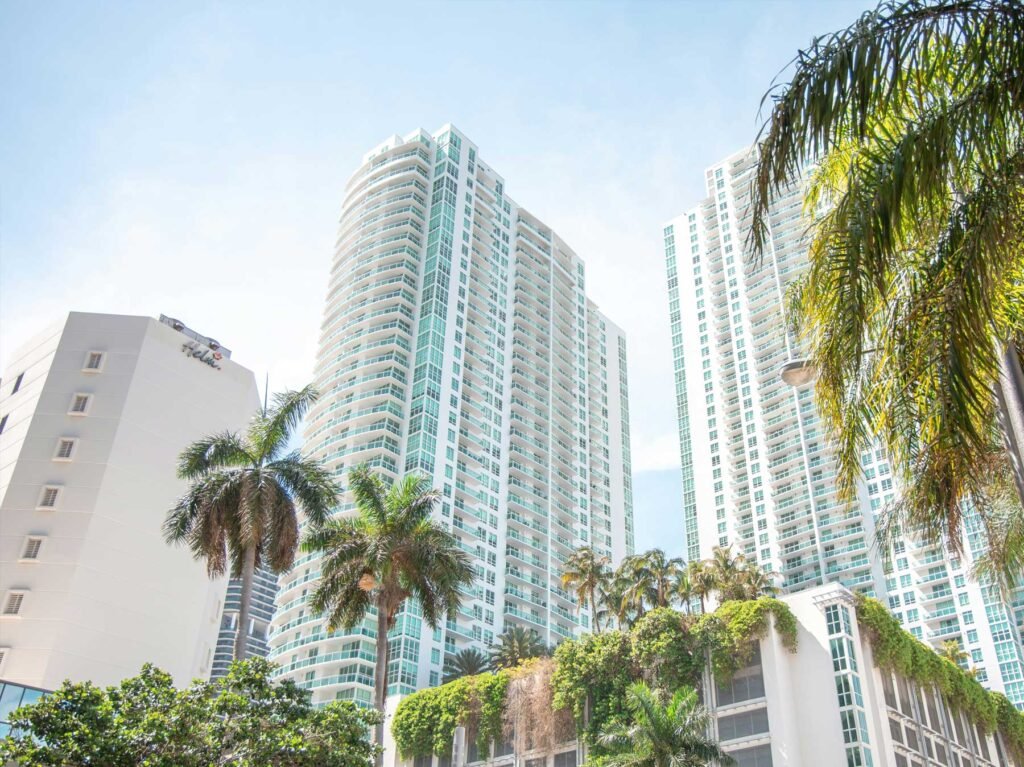
Miami Luxury Condos · Brickell · Emerald at Brickell
One hundred and sixteen of the 142 homes have a complete round trip on record.
By Josh Stein · Florida license SL3057661 · Updated 12 October 2026Leer en español →
No condos for sale at Emerald at Brickell right now.
- Months of inventory0.0
- Sold, 12 months1


Listing information is deemed reliable but is not guaranteed and is provided exclusively for consumers' personal, non-commercial use. Data is supplied by the MLS and may be subject to change or withdrawal without notice.
Last updated 1 second ago
Key facts about Emerald at Brickell
| Address | 218 SE 14th Street, Miami FL 33131 |
|---|---|
| For sale now | 0 |
| For rent now | 2 |
| Monthly HOA | $1,691 to $2,053 |
| Year built | 2006 |
| Amenities | Business Center, Clubhouse, Elevators, Fitness Center, Maintenance Grounds, Management, Parking, Pool |
| Neighborhood | Miami |
Residences at Emerald at Brickell
| Bedrooms | For sale | Size (sq ft) | List price | Avg $/sq ft | Last sale |
|---|---|---|---|---|---|
| 2 | 0 | $620,000 (September 30, 2026) |
Recently sold in
4 listings


Verified 23 September 2026Miami-Dade County Property Appraiser1 source
Key Takeaways
- Emerald at Brickell recorded 5 sales in the 12 months to 23 September 2026 — at a median of $380,000, or $463 per square foot, on the Miami-Dade County Property Appraiser record. The latest recorded sale was on 24 June 2026. Own at Emerald at Brickell? Ask Josh what yours would sell for on WhatsApp.
- One hundred and sixteen of the 142 homes have a complete round trip on record — and every single one of them begins at the 2006 to 2008 sell-out — 70 gained, 46 lost, a median of +7.4% over 13.5 years.
- When you sold decided almost everything — of the 53 owners who held until 2021 or later, only 13.2% lost money and the median was +31.1%. The catastrophic losses all sold between 2009 and 2011.
- The worst outcome on record is −78.9% — a 1,110 square foot home bought for $950,000 in May 2007 and sold for $200,000 in February 2010.
- The highest price ever paid here was in 2006 — $1,280,000 for the 2,847 square foot penthouse — and twenty years later the building has not matched it.
- It is unusually repetitive, which makes it easy to price — four floorplates account for 72 of the 142 homes, at 18 apiece.
- It trades rarely — 23 qualified sales across four years in 142 homes — about one home in twenty-five each year.
Emerald at Brickell, by the numbers
Developer: SunVest Communities USA · Architect: Fullerton-Diaz Architects. Source: the building record on this site.
218 SE 14th Street, Miami, Florida 33131 | Neighborhood: Brickell
What is actually inside the building
The Miami-Dade County Property Appraiser holds 142 folios for The Emerald at Brickell at 218 SE 14th Street, and all 142 of them are homes. No commercial folio, no parking or storage series, one declaration at one address. The common-element shares close at exactly 100.0000%, so this is the whole condominium.
The homes run 811 to 2,847 square feet, with a median of 1,110. The mix is close to even: 70 two-bedrooms and 63 one-bedrooms, with nine three-bedrooms.
What sets this building apart is repetition. Four floorplates account for 72 of the 142 homes — 1,594 square feet, 1,298, 1,264 and 811, eighteen of each — with a further 30 across two more. That is an unusually uniform building, and it means almost any home here has a direct comparable rather than an approximate one.
The 2026 assessed values run $184,690 to $1,187,419, with a median of $405,162.
The building where the exit year decided everything
One hundred and eighty-five qualified sales were recorded between 2006 and 2008, 139 of them in 2006 alone, at a median of $426,455 and $393 per square foot. Every completed round trip in this building starts there. Not most: all of them.
One hundred and sixteen of the 142 homes have since resold. Seventy gained and 46 lost, a median of +7.4% over a median holding period of 13.5 years, with a range from −78.9% to +185.7%.
A 40% loss rate reads badly, and taken alone it would be a misleading way to describe this building. Split the same 116 by when the owner sold and it becomes a different page:
| Group | Round trips | Sold at a loss | Median outcome |
|---|---|---|---|
| All owners | 116 | 39.7% | +7.4% |
| Those who held until 2021 or later | 53 | 13.2% | +31.1% |
Of the 53 owners who held on, fewer than one in seven lost money, and the median one is up 31.1% over 15.9 years. The severe losses are concentrated in a narrow window of exits:
- A 1,110 square foot home bought for $950,000 in May 2007 sold for $200,000 in February 2010 — down 78.9%.
- A 1,654 square foot home bought for $1,250,000 in August 2007 sold for $280,000 in August 2009 — down 77.6%.
- A 1,654 square foot home bought for $916,900 in September 2006 sold for $380,000 in August 2011 — down 58.6%.
And the same building, held:
- A 1,932 square foot home bought for $315,000 in December 2008 sold for $900,000 in March 2024 — up 185.7%.
- An 811 square foot home bought for $200,000 in May 2008 sold for $510,000 in April 2025 — up 155.0%.
The county record shows transactions and not reasons, so it cannot tell you whether those early sellers were forced or chose to go. What it does establish, unusually cleanly, is that in this building the purchase year was the same for everybody and the exit year was not — so almost the whole spread of outcomes is attributable to when an owner sold. Twenty-six homes have never resold at all and appear in none of these figures.
All of these are gross figures: the difference between two recorded prices, before commissions, closing costs, taxes and assessments.
The price record
Qualified, arm’s-length sales from the county record, retrieved 21 August 2026. The 12-month figures at the top of this page and in the FAQ come from the 23 September 2026 pull, which adds a 2026 sale on 24 June ($375,000, 826 square feet) and brings 2026 to date to three sales, a median of $380,000 and $463 per square foot.
| Year | Qualified sales | Median price | Median $/sq ft |
|---|---|---|---|
| 2023 | 10 | $653,500 | $532 |
| 2024 | 5 | $490,000 | $523 |
| 2025 | 6 | $455,000 | $485 |
| 2026 to date | 2 | $490,000 | $602 |
Twenty-three qualified sales in four years across 142 homes is about one home in twenty-five each year. The per-foot column drifts down from $532 to $485 across 2023 to 2025 and then jumps to $602 on two sales in 2026, which is not a recovery so much as a sample of two. I would read this table as a band of roughly $460 to $600 per square foot and no more than that.
There is one figure here that deserves to be stated plainly. The highest price ever paid at The Emerald is $1,280,000, on 1 September 2006, for the 2,847 square foot penthouse. Four more sales between $1,215,000 and $1,250,000 all fall in 2006 and 2007. The highest price recorded in the twenty years since is $1,125,000, in January 2021. In nominal terms this building has not beaten its own opening year.
That is a real fact about the top of the building and it should not be read as a fact about all of it. The 2008 buyer of an 811 square foot home is up 155.0%; the 2007 buyer of a 1,654 square foot home is not. Ceiling prices and typical outcomes are different questions here, and mixing them is how this building gets described wrongly in both directions.
Who this building suits
It suits a buyer who wants to price precisely. Four floorplates cover half the building at eighteen homes each, and there are 353 qualified sales on record across its history. Very few buildings in Brickell let you compare a home to seventeen identical ones.
It suits a long holder, and the evidence for that is about as direct as county data gets. Everyone here bought at the same time; the ones who held to 2021 or later have a 13.2% loss rate and a median of +31.1%, and the ones who left in 2009 to 2011 have losses running to 78.9%. Same building, same apartments, same purchase years.
It suits a buyer chasing the building’s top end badly. The record prices here are twenty years old and have not been matched. If you are being asked to pay near the 2006 and 2007 numbers for a larger home, the county record gives you a specific and checkable reason to push back.
It suits someone who wants an inexpensive Brickell home more than they want a story. A median assessed value of $405,162 in this location is the plain case for the building, and it does not depend on any of the analysis above.
If you are selling here, the year you bought is almost certainly 2006, 2007 or 2008 — and so is every comparable seller’s. That cuts both ways: a buyer’s agent can find the crash-era resales easily, and you can just as easily show that owners who held have a 13.2% loss rate rather than a 40% one. Price against your own floorplate, of which there are probably seventeen others. Ask me for the per-foot record on your line before you set a number.
Own at Emerald at Brickell?
If you own here, this page already carries the county’s record of what homes in Emerald at Brickell have sold for. Here is how to use it.
Your three options
- Sell. Price against what comparable homes in the building have actually recorded, not against asking prices.
- Rent it out. Within the condominium’s rental rules, which vary from building to building.
- Hold. Watch the record: this page is updated from the county as new sales are posted.
What I will send you
Tell me your unit. I will send you the recorded sales of comparable homes in Emerald at Brickell, what they sold for per square foot, and a straight read on what yours could sell for today.
Two free things for owners
How this building compares: the Miami Condo Index ranks buildings by price per square foot and four-year change from the county record, the Miami Resale Record shows how often resales closed below the seller’s price, and the 100 Latest Sales list shows MLS closings as they post. Every building we cover is on the Miami Luxury Condos page.
The Emerald at Brickell — Frequently Asked Questions
What have homes at Emerald at Brickell sold for in the last 12 months?
5 sales were recorded on the Miami-Dade County Property Appraiser record in the 12 months to 23 September 2026, at a median of $380,000 ($463 per square foot). The latest recorded sale was on 24 June 2026. These are recorded closings, not asking prices. If you own at Emerald at Brickell and want to know what your home would sell for, message Josh Stein on WhatsApp at (305) 695-8257.
Have owners at The Emerald at Brickell made money?
It depends almost entirely on when they sold. Across all 116 completed round trips, 70 gained and 46 lost, a median of +7.4% over 13.5 years. But of the 53 owners who held until 2021 or later, only 13.2% lost money and the median outcome is +31.1%. Every round trip in the building begins at the 2006 to 2008 sell-out, so the purchase year is the same for everyone and the exit year is not.
What is the worst loss recorded at The Emerald at Brickell?
A 1,110 square foot home bought for $950,000 in May 2007 and sold for $200,000 in February 2010 — down 78.9%. The next worst is a 1,654 square foot home bought at $1,250,000 in August 2007 and sold for $280,000 in August 2009. Both exits fall inside the 2009 to 2011 window that accounts for the severe losses here.
What is the most expensive sale at The Emerald at Brickell?
$1,280,000, on 1 September 2006, for the 2,847 square foot penthouse — a sell-out purchase. Four further sales between $1,215,000 and $1,250,000 all fall in 2006 and 2007. The highest price recorded in the twenty years since is $1,125,000, in January 2021.
How often do homes at The Emerald at Brickell sell?
About one home in twenty-five each year: 23 qualified sales across 2023, 2024, 2025 and 2026 to date, in 142 homes.
What does a home at The Emerald at Brickell cost per square foot?
The qualified sales since 2023 sit in a band of roughly $460 to $600 per square foot. The medians run $532 in 2023, $523 in 2024 and $485 in 2025, then $602 on two sales in 2026 to 21 August and $463 on three sales to 23 September, so I would treat the band rather than the movement as the finding.
How big are the homes at The Emerald at Brickell?
From 811 to 2,847 square feet, with a median of 1,110. Seventy are two-bedrooms, 63 are one-bedrooms and nine are three-bedrooms. Four floorplates account for 72 of the 142 homes — 1,594 square feet, 1,298, 1,264 and 811, eighteen of each. The 2026 assessed values run $184,690 to $1,187,419, median $405,162.
Is The Emerald at Brickell easy to value?
Unusually so, for a Brickell building. Four floorplates cover half of it at eighteen homes apiece and the county holds 353 qualified sales across its history, so most homes here have a direct comparable rather than an approximate one. The difficulty is not finding comparables; it is that the recent ones are few — 23 across four years.
Sources and further reading
Interested in selling in Emerald at Brickell?
Learn more about selling your condo in Emerald at Brickell with Josh Stein.
Thinking about Emerald at Brickell?
I have sold South Florida property since 2002, more than $1 billion of it. Ask me for the recorded declaration, what has genuinely closed, or a straight answer on whether this building fits what you are after.
Josh Stein · Florida real estate sales associate, license SL3057661 · (305) 695-8257 · hello@joshsteinrealtor.comGet this building’s next recorded sale — before the listing sites catch up
- Every closed sale we can verify from the Miami-Dade record — price, date, and $/sqft when the deed supports it — not an IDX feed.
- Optional alert when a new deed posts in this building (or a short list of comps you choose).
- No spam inventory blasts. One building. One record. You decide what happens next.
Tell Josh which building. He’ll send the latest closed sales and set a quiet alert.
Get the sales recordRelated coverage
Part of Miami Luxury Condos.