

Miami Luxury Condos · North Bay Village · The Bridgewater
By Josh Stein · Florida license SL3057661 · Updated 3 September 2026
Verified 26 August 2026Miami-Dade County Property Appraiser1 source
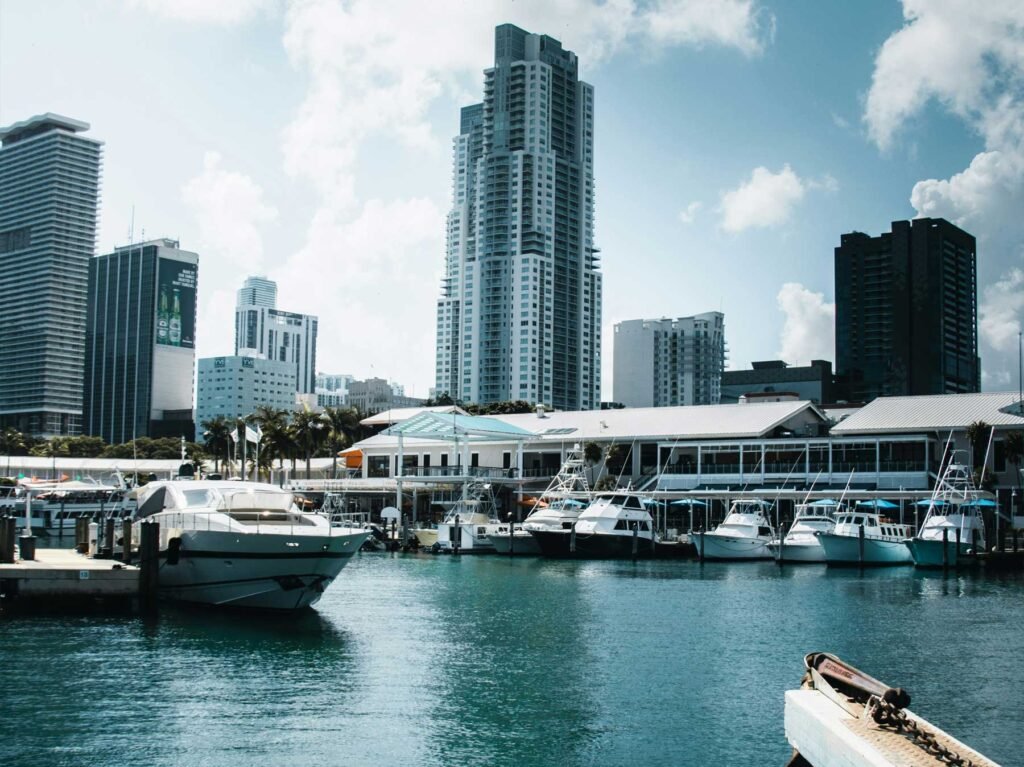
The Bridgewater — photography to follow
Building facts
- Address
- 1881 79th Street Causeway
- Neighborhood
- North Bay Village
- Year built
- 2006
- Floors
- 21
- Residences
- 118
- Developer
- Fortune International Group
- Architect
- Kobi Karp
- Status
- Delivered — completed 2006
Key Takeaways
- 🔴🔴 Twenty years on, this building has not made money — The developer’s own buyers closed in 2006 and 2007 at a median of $337 per square foot. Sales in 2024 to 2026 have a median of $335. That is 0.5% lower, in nominal dollars, after twenty years — before any allowance for inflation.
- ⭐⭐ Four out of five of the original buyers who sold, lost money — Of the 69 clean resale pairs that begin at a 2006–07 developer closing, 57 — 82.6% — sold for less than they paid, at a median of −36.6% over a median hold of 5.1 years.
- ⭐⭐ More than a quarter of the building went through a foreclosure — The county record carries 65 lender or in-lieu-of-foreclosure transfers across 34 of the 118 homes — 28.8% of the building. That is what the 2008 cycle did here, and it is still in the deed record.
- The crash, measured — Median price per square foot fell from $337 in 2006–07 to $163 in 2009–12 — a fall of 51.7%, on 46 sales. It did not exceed the 2006 level again until 2023.
- This is the cheapest building in North Bay Village that we have measured — $335 per square foot against $395 at The Lexi, $412 at 360 Condos and $615 at Cielo on the Bay. 360 Condos is almost exactly the same size of home and trades 23.0% higher per foot.
- Every single home here is a two-bedroom — All 118 of them, two bedrooms and two bathrooms, in seven floor plans — one per line — from 1,171 to 1,470 square feet. There is no studio, no one-bedroom, no three-bedroom and no penthouse floor plan in the declaration.
- 🔴 The county does not recognise the marketed address — Seven forms of 1881 79th Street Causeway return zero records. The building is folio series 23-3209-050, declaration THE BRIDGEWATER CONDO. Ask for the folio.
The Bridgewater, by the numbers
Architect: Kobi Karp. Source: the building record on this site.
1881 79th Street Causeway, North Bay Village, Florida 33141 | Neighborhood: North Bay Village
The Bridgewater is a 21-storey, 118-home condominium on Treasure Island in North Bay Village, completed in 2006. It has one of the longest and most complete transaction records of any building we have pulled, and that record says something uncomfortable that no listing page carries: two decades after it opened, homes here sell for about what they sold for the first time.
What the county records at The Bridgewater
The Miami-Dade County Property Appraiser holds 118 folios in the declaration THE BRIDGEWATER CONDO, recorded at OR 25144-1520. All 118 are classified RESIDENTIAL — CONDOMINIUM, and the undivided ownership shares sum to 100%, so the record below is the whole building. The county records the year built as 2006.
Every home in the building is a two-bedroom, two-bathroom. All 118. There is no other configuration in the declaration — no studio, no one-bedroom, no three-bedroom, no penthouse plan.
The homes sit on floors 4 through 21, seven to a floor (six on the fourth), in seven vertical lines with one floor plan each. The county’s own unit numbering runs 401 to 2107 and skips the thirteenth floor entirely.
| Line | Size | Homes |
|---|---|---|
| 01 | 1,470 sq ft — the largest plan | 17 |
| 02 | 1,413 sq ft | 17 |
| 03 | 1,195 sq ft | 16 |
| 04 | 1,221 sq ft | 17 |
| 05 | 1,171 sq ft — the smallest plan | 17 |
| 06 | 1,274 sq ft | 17 |
| 07 | 1,262 sq ft | 17 |
Median home: 1,262 square feet. Assessed values for 2026 run $172,010 to $520,866, median $314,612, totalling $41,371,907 across the building.
⚠️ On the architect. The county publishes no architect, and the attribution that circulates for this building — Kobi Karp — appears only on broker and listing-aggregator pages, which this site does not treat as sources. It is very widely published and it may well be right. We have not confirmed it against a primary source, and we would rather say so than repeat it as fact.
⚠️ And on the “Pricing” line in the grey box at the top of this page: that is an asking figure from a listing feed, not a transaction. Everything below is recorded deeds.
Twenty years, and the price per square foot has not moved
The county holds 305 qualified, arm’s-length sales at The Bridgewater, beginning with the developer’s closings in December 2006. Grouped into periods, so that no single thin year drives the reading:
| Period | Qualified sales | Median price | Median $/sq ft |
|---|---|---|---|
| 2006–07 — developer closings | 125 | $432,889 | $337 |
| 2009–12 — the trough | 46 | $209,750 | $163 |
| 2013–16 | 37 | $350,000 | $266 |
| 2017–20 | 32 | $270,000 | $219 |
| 2021–23 | 50 | $400,000 | $325 |
| 2024–26 | 12 | $400,000 | $335 |
Read the first row and the last row together, because that is the whole story. The developer’s buyers paid a median of $337 per square foot in 2006 and 2007. Buyers in 2024, 2025 and 2026 have paid a median of $335. That is 0.5% lower. On the median ticket it is $432,889 down to $400,000, a fall of 7.6%.
Those are nominal dollars. No adjustment for twenty years of inflation has been made, and none is needed to make the point: a home bought from the developer and sold today returns the buyer roughly what they put in, two decades later, before costs.
⚠️ Twelve sales is a thin recent window and I am not going to pretend otherwise. But the 2021–23 block behind it holds fifty sales at $325 a foot, and the two agree. The conclusion does not rest on the last twelve transactions alone.
The fall in the middle was severe and it is fully recorded here. Median price per square foot went $337 to $163 — down 51.7% — across 46 sales in 2009–12. It took until 2023 for a single year’s median to exceed the 2006 figure. Seventeen years to get back to level.
And the building barely trades. Since 2008 the county records 180 qualified sales — about 9.5 a year across 118 homes, or one home in twelve per year. Thirteen homes have never been sold at all since their original developer deed.
Who lost money here, and by how much
The county record holds 139 clean resale pairs across 83 of the 118 homes — pairs where one qualified sale is followed directly by another with nothing in between. Sixty-seven of them, 48.2%, sold for less than they cost. Median holding period 4.6 years; median change +6.8%.
| Held for | Pairs | Sold at a loss | Median change |
|---|---|---|---|
| Under 3 years | 41 | 26.8% | +27.3% |
| 3 to 5 years | 35 | 65.7% | −39.2% |
| 5 to 10 years | 38 | 52.6% | −10.6% |
| Over 10 years | 25 | 52.0% | −11.1% |
The single most useful number on this page is not in that table. Isolate only the pairs that begin at a 2006 or 2007 developer closing — the people who bought the building new:
Sixty-nine such pairs. Fifty-seven of them — 82.6% — sold at a loss. The median outcome was −36.6%, over a median hold of 5.1 years.
The extremes, each read against the folio’s entire sale history rather than the two rows in isolation:
- Worst: unit 1701, 1,470 sq ft. $585,000 in February 2007 → $200,000 in August 2011. −65.8% in 4.5 years.
- Second: unit 1801, the same plan. $579,256 in December 2006 → $210,000 in January 2012. −63.7%.
- Third: unit 1907, 1,262 sq ft. $565,450 in December 2006 → $215,000 in June 2011. −62.0%.
- Best: unit 1502, 1,413 sq ft. Bought for $150,000 in 2014, sold for $650,000 on 27 May 2025 — +333.3% over 11.4 years.
⭐ Unit 1502 is worth a moment, because it is the whole building in one apartment. It closed with the developer in 2007 at $548,244. In 2009 the lender took it — two transfers, a $100 certificate of title and a $224,500 disposal, both recorded as in-lieu-of-foreclosure. It sold at $150,000 in 2014 and again at $650,000 in 2025. The best trade in the building’s history and one of its worst are the same home, and the thing that separates them is when you arrived.
The foreclosures: 34 of 118 homes
The county record carries 65 lender or in-lieu-of-foreclosure transfers, touching 34 of the 118 homes — 28.8% of the building.
That number matters for two separate reasons.
First, it is the honest measure of what happened here. A building that delivers in 2006 at the top of a cycle, into a market that then falls by half, does not simply record lower prices. It records people losing their homes. More than a quarter of this building did.
Second, it is a warning about how price histories get read. Our own first pass at this building chained qualified sales together and skipped whatever sat between them. That produced a headline “worst resale” of −72.6% — unit 1502, $548,244 down to $150,000. It is not a resale at all: the lender took the home in between, so those two prices belong to two different owners. We caught it by reading the raw rows and recomputed everything on adjacent transactions only. Every figure on this page comes from the corrected run. If you are shown a loss statistic for any Miami building from the 2006–12 period, ask whether it steps over the foreclosures. Most do.
How it compares across North Bay Village
We have pulled the full county record for six North Bay Village condominium declarations. Comparing their 2024–26 recorded sales:
| Building | Homes | Median home | Sales 2024–26 | Median price | Median $/sq ft |
|---|---|---|---|---|---|
| The Bridgewater | 118 | 1,262 sq ft | 12 | $400,000 | $335 |
| The Lexi | 163 | 1,735 sq ft | 22 | $660,000 | $395 |
| 360 Condos | 99 | 1,251 sq ft | 13 | $558,800 | $412 |
| Eloquence on the Bay | 77 | 1,398 sq ft | 8 | $605,000 | $481 |
| Space 01 | 53 | 1,848 sq ft | 12 | $888,500 | $481 |
| Cielo on the Bay | 35 | 1,910 sq ft | 6 | $1,175,000 | $615 |
The Bridgewater is the cheapest of the six per square foot, and the comparison that does the real work is 360 Condos. Its median home is 1,251 square feet against The Bridgewater’s 1,262 — under one per cent apart — and its first sales were recorded in 2007, so the two buildings delivered into the same cycle, at the same scale of home, a few minutes apart. 360 Condos trades at $412 a foot. The Bridgewater trades at $335. That is a 23.0% gap on a like-for-like product.
This page is not going to tell you why. Frontage, association fees, reserves, building condition, the recertification position and the mix of owner-occupiers to renters would all have to be examined, and none of them is in the tax roll. But if you are buying here, that 23% is the question to walk in with, and if you are selling here, it is the number your buyer is going to find.
⚠️ These are small annual counts — six to twenty-two sales per building over three years. They establish a level, not a trend.
Worth noting alongside all of it: North Bay Village is in the middle of the largest development in its history. Continuum North Bay Village, a two-phase, 3.6-acre district a few blocks away, is selling its first 236 residences for delivery in July 2028. What that does to the resale values of the island’s 2006-era stock is unknown, and anyone who tells you confidently in either direction is guessing.
The address the county has no record of
The Bridgewater is marketed at 1881 79th Street Causeway, sometimes written 1881 NE 79th Street. 🔴 The Miami-Dade address index returns zero records for either, and for five other forms we tried.
To be certain that was the county’s answer rather than a bad query, we swept the causeway: 81 parcels on Kennedy Causeway, matched against the county’s own total of 81. The numbering stops at 1710. A search for “John F Kennedy Cswy” returns 123 rows, and every one of them is a parcel on NE 79th Street in the City of Miami — a different municipality on the mainland end of the same road.
The building was found by enumerating North Bay Village’s condominium declarations by folio series until it appeared. 23-3209-050 is THE BRIDGEWATER CONDO.
This is the fifth building in this programme whose marketed address the county does not index, and the practical advice is the same every time: ask for the folio number, not the street address. A price, a tax figure or a sale history quoted against an address the county has never heard of came from somewhere else.
⚠️ One note on dates. Thirty-five of the 305 qualified sale rows carry the county’s year-only placeholder of 1 January — thirty-four of them in 2007. Where a row carries that placeholder this page quotes the year, and where it carries a month-and-year convention it quotes the month. We do not invent a day the record does not hold.
Who this building suits, and who it does not
It suits a buyer who wants the most home per dollar in North Bay Village and intends to keep it. At a median of $400,000 for a 1,262 square foot two-bedroom on the water, in a building where every home is the same class of product, this is the cheapest square footage on the island that we have measured. For an owner-occupier with a long horizon, or for someone buying to hold and let, the entry price is the argument.
It suits badly anyone buying this as an appreciation play, and the record is unusually clear about why. Twenty years of transactions in one building, 305 of them, produce a median price per square foot today that is fractionally below where it started. 82.6% of the people who bought it new and sold it lost money. Whatever this building is, it has not been a way to make money on Miami real estate, and there is more evidence for that statement than for almost anything else on this site.
The one thing I would want answered before buying here is the 23% gap to 360 Condos. Two buildings of the same age and the same size of home, minutes apart, and one trades a quarter higher. That difference is real money and it has a cause. Ask the association, ask for the budget and the reserves, ask for the structural reserve study, and ask what the building’s recertification position is — a 2006 building in Miami-Dade is inside the window where the county’s milestone inspection programme starts to matter, and the town’s building department can tell you exactly when.
To an owner thinking of selling: the good news is that the last three years are the strongest stretch the building has had since 2007, and 2026’s four recorded sales came in at a median of $359 a foot, comfortably above the three-year median — though still short of 2023’s $393. The hard news is that your buyer can pull the same 305 rows we did, and there is no version of this history that reads as a growth story. Price against the building’s own record, not against the island’s new construction.
The Bridgewater North Bay Village — Frequently Asked Questions
How many units are in The Bridgewater and what are they?
118, and every single one is a two-bedroom, two-bathroom. The county records 118 folios in the THE BRIDGEWATER CONDO declaration, on floors 4 to 21, seven per floor, in seven floor plans from 1,171 to 1,470 square feet, median 1,262. The building was completed in 2006 and the unit numbering skips the thirteenth floor.
What do homes at The Bridgewater sell for?
Sales in 2024 to 2026 have a median of $400,000, or $335 per square foot, on 12 recorded transactions. The 50 sales in 2021–23 ran at $400,000 and $325 a foot, so the two windows agree. 2026’s four sales came in at a median of $359 a foot, above the three-year median but below 2023’s $393.
Has The Bridgewater appreciated since it was built?
🔴 No, and this is the clearest finding in the record. The developer’s buyers closed in 2006–07 at a median of $337 per square foot. Sales in 2024–26 have a median of $335 — 0.5% lower in nominal dollars after twenty years, before inflation. Median price fell from $432,889 to $400,000.
Do people lose money at The Bridgewater?
Frequently. Of 139 clean resale pairs, 67 — 48.2% — sold for less than they cost. Among the 69 pairs that begin at a 2006–07 developer closing, 57 — 82.6% — lost money, at a median of −36.6%. The worst on record is unit 1701: $585,000 in February 2007 to $200,000 in August 2011.
Were there foreclosures at The Bridgewater?
Many. The county record carries 65 lender or in-lieu-of-foreclosure transfers across 34 of the 118 homes — 28.8% of the building. ⚠️ This also distorts price histories: a loss statistic that chains sales together without checking what sat between them will step straight over a foreclosure and attribute two owners’ outcomes to one.
How does The Bridgewater compare with other North Bay Village buildings?
It is the cheapest per square foot of the six we have pulled. On 2024–26 medians: Bridgewater $335, The Lexi $395, 360 Condos $412, Eloquence on the Bay $481, Space 01 $481, Cielo on the Bay $615. 360 Condos is the fair comparison — a median home of 1,251 sq ft against 1,262 here, first sold in the same 2007 cycle — and it trades 23.0% higher per foot.
Why does a search for 1881 79th Street Causeway find nothing?
Because the county does not index that address in any form we could find, and a complete sweep of Kennedy Causeway (81 parcels against the county’s own total of 81) stops at 1710. The building is folio series 23-3209-050. Ask for a folio number rather than searching the street address — and treat any price history quoted against that address as coming from somewhere other than the county.
Sources and further reading
Interested in selling at The Bridgewater
Learn more about selling condo at The Bridgewater with Josh Stein.
Interested in buying at The Bridgewater?
Learn more about buying at The Bridgewater with Josh Stein.
Thinking about The Bridgewater?
I have sold South Florida property since 2002, more than $1 billion of it. Ask me for the recorded declaration, what has genuinely closed, or a straight answer on whether this building fits what you are after.
Josh Stein · Florida real estate sales associate, license SL3057661 · (305) 695-8257 · hello@joshsteinrealtor.comGet this building’s next recorded sale — before the listing sites catch up
- Every closed sale we can verify from the Miami-Dade record — price, date, and $/sqft when the deed supports it — not an IDX feed.
- Optional alert when a new deed posts in this building (or a short list of comps you choose).
- No spam inventory blasts. One building. One record. You decide what happens next.
Tell Josh which building. He’ll send the latest closed sales and set a quiet alert.
Get the sales recordRelated coverage
Part of Miami Luxury Condos.