

Building facts
- Address
- 1010 SW 2nd Avenue
- Neighborhood
- Brickell
- Year built
- 2017
- Floors
- 22
- Residences
- 155
- Status
- Completed
- Developer
- IB Corp. and Waterstone Capital
- Architect
- BC Architects
- Pricing
- Starting at $425,000
Verified 21 August 2026Miami-Dade County Property Appraiser1 source
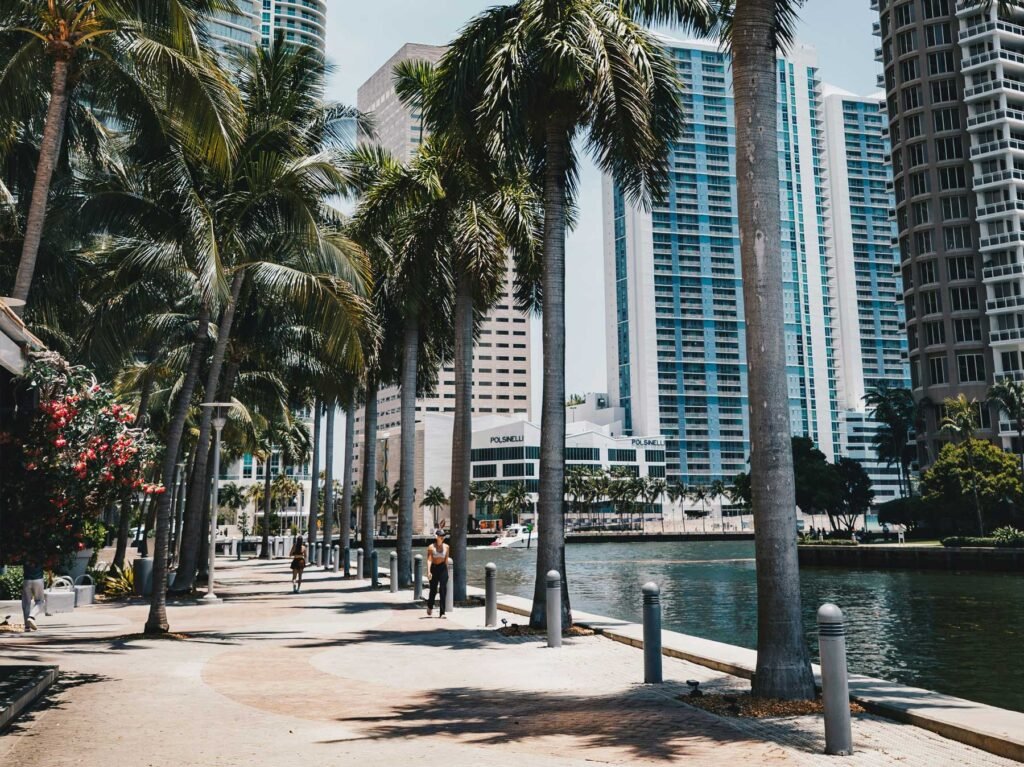
Brickell Ten — photography to follow
Key Takeaways
- The price per square foot here has barely moved in four years — $557, $578, $573 and $573 across 2023 to 2026 — a total spread of 3.8%, while the median price swung by more than $230,000.
- Seventy-three of the 155 homes have a complete round trip on record — 55 gained and 18 lost, a median of +16.8% over 5.3 years.
- The losses are almost all early exits — of the 64 owners who sold in 2021 or later, only 14.1% went out below what they paid.
- The worst outcomes were all sold within eighteen months of buying — down 26.2%, 23.9% and 22.6%, every one of them a 2018 to 2020 exit from a 2017 purchase.
- The record sale is recent — $1,010,000 in November 2025 for a 1,638 square foot home — the same apartment cost $684,500 at the 2017 sell-out.
- Six floorplates cover 84 of the 155 homes — at exactly fourteen apiece, so most homes here have thirteen identical comparables.
Brickell Ten, by the numbers
Developer: IB Corp. and Waterstone Capital · Architect: BC Architects · Starting at $425,000. Source: the building record on this site.
1010 SW 2nd Avenue, Miami Florida 33130 | Neighborhood: Brickell
What is actually inside the building
The Miami-Dade County Property Appraiser holds 161 folios for Brickell Ten at 1010 SW 2nd Avenue, of which 155 are homes. The other six are five ground-floor commercial units and an aggregate reference folio, and all six are excluded from every figure below — a raw folio count overstates this building by six. The declaration’s common-element shares close at 99.9973%, so this is the whole condominium.
The homes run 648 to 1,669 square feet, with a median of 940. The mix is 69 two-bedrooms, 57 one-bedrooms and 29 three-bedrooms.
Six floorplates cover 84 of the 155 — 933 square feet, 731, 1,273, 1,024, 766 and 940, at exactly fourteen homes each. Most homes here therefore have thirteen identical comparables, which makes the per-foot figures below far more solid than the sale counts alone would suggest.
The 2026 assessed values run $248,263 to $785,478, with a median of $422,197.
A building where the rate has not moved
Qualified, arm’s-length sales from the county record, retrieved 21 August 2026.
| Year | Qualified sales | Median price | Median $/sq ft |
|---|---|---|---|
| 2023 | 15 | $535,000 | $557 |
| 2024 | 12 | $574,500 | $578 |
| 2025 | 8 | $767,500 | $573 |
| 2026 to date | 3 | $535,000 | $573 |
Most building pages on this site have to warn that the median price is distorted by which floorplates sold. This one is the clearest demonstration of it I have measured.
The median price runs $535,000, then $574,500, then $767,500, then back to $535,000 — a swing of more than $230,000, which read on its own would suggest a 43% surge followed by a 30% collapse. Per square foot over the same four years: $557, $578, $573, $573. A total spread of 3.8%.
Nothing happened. Larger homes sold in 2025 and smaller ones in 2026, and the median price simply reports that. My honest reading is that this building has traded within a few per cent of $570 per square foot for four straight years, and that the median price column should be ignored entirely.
Thirty-eight qualified sales in four years across 155 homes is about one home in sixteen each year — reasonable turnover, and enough that most of the six main plates have something recent to point at.
The record sale is $1,010,000, on 17 November 2025, for a 1,638 square foot three-bedroom — $617 per square foot. That apartment has a complete history: $684,500 at the 2017 sell-out, $715,000 in June 2020, and $1,010,000 in November 2025.
What happened to the 2017 buyers
One hundred and fifty-five homes recorded a first qualified sale in 2017 and 2018 — 140 of them in 2017 — at a median of $428,000 and $444 per square foot.
Seventy-three of those buyers have since sold. Fifty-five gained and 18 lost, a median of +16.8% over a median holding period of 5.3 years. Eighty-two homes have never resold.
The losses are concentrated in short holds, and specifically in exits before 2021:
- A 766 square foot home bought for $355,000 in July 2017 sold for $262,000 in December 2018 — down 26.2% in 1.4 years.
- A 1,037 square foot home bought for $440,000 in May 2017 sold for $335,000 in June 2020 — down 23.9%.
- A 766 square foot home bought for $323,000 in May 2017 sold for $250,000 in November 2018 — down 22.6% in 1.5 years.
Of the 64 owners who held until 2021 or later, only 14.1% sold at a loss, at a median of +18.4%. The pattern is about as clean as this data gets: leaving early cost money, holding did not.
At the other end:
- A 1,420 square foot home bought for $586,600 in April 2017 sold for $1,000,000 in September 2025 — up 70.5%.
- A 1,273 square foot home bought for $495,700 in September 2017 sold for $760,000 in April 2025 — up 53.3%.
One deed is excluded from all of the above and I would rather say so than drop it quietly. The county flags a sale of $334,400 on 29 January 2018 for the 1,655 square foot penthouse as qualified. That is $202 per square foot against a sell-out band running $351 to $547, it sits between three $100 corrective deeds, and the same apartment sold for $683,100 ten weeks later at $413 per square foot. Counted, it would report this building’s best result as +118.0%. The real round trip on that home is $683,100 in April 2018 to $729,000 in December 2021, up 6.7%.
All figures are gross, before commissions, closing costs, taxes and assessments. The county record shows transactions and not reasons, so it cannot say why any of the early sellers went when they did.
Who this building suits
It suits a buyer who wants a predictable price. Four years within 3.8% on the per-foot rate, with thirteen identical comparables for most homes, is about as legible as Miami condominium pricing gets. You can work out what a home here is worth without arguing about it.
It suits a buyer with a horizon beyond three years. The eighteen losses in this building are overwhelmingly short holds — the three worst were all sold within eighteen months — while 86% of those who held past 2021 came out ahead.
It suits a buyer expecting rapid appreciation badly, and the flat per-foot record is exactly why. The rate has not moved since 2023 and stands roughly 29% above the 2017 sell-out median across nine years, before any cost of ownership. This is a stable building, not a rising one, on the evidence available.
It suits a buyer who wants a large home poorly — the biggest apartment here is 1,669 square feet, and there are few of them.
If you are selling here, price per square foot and be ready to explain why the building median is meaningless. A buyer’s agent quoting the 2025 median of $767,500 or the 2026 median of $535,000 is quoting floorplate mix, not value; the rate has been $570 either way. Your own plate probably has thirteen twins and several recent sales. Ask me for the per-foot record on your plate before you set a number.
Brickell Ten — Frequently Asked Questions
What does a home at Brickell Ten cost per square foot?
Almost exactly the same as it did four years ago: $557 in 2023, $578 in 2024, $573 in 2025 and $573 in 2026 to date — a total spread of 3.8%. The median price over the same years swung from $535,000 to $767,500 and back to $535,000, but that is floorplate mix rather than value.
Have owners at Brickell Ten made money?
Most have. Seventy-three of the 155 homes have a complete round trip on record: 55 gained and 18 lost, a median of +16.8% over a median holding period of 5.3 years. Of the 64 who sold in 2021 or later, only 14.1% went out below what they paid.
Who lost money at Brickell Ten?
Almost entirely the short holders. The three worst outcomes are a 766 square foot home down 26.2% after 1.4 years, a 1,037 square foot home down 23.9%, and another 766 square foot home down 22.6% after 1.5 years — all 2017 purchases sold between 2018 and 2020.
What is the most expensive sale at Brickell Ten?
$1,010,000 on 17 November 2025, for a 1,638 square foot three-bedroom — $617 per square foot. That apartment has a complete history: $684,500 at the 2017 sell-out, $715,000 in June 2020 and $1,010,000 in November 2025.
Why is one Brickell Ten sale excluded from this page?
Because it is not an arm’s-length price whatever the county flag says. A $334,400 deed of 29 January 2018 on the 1,655 square foot penthouse works out at $202 per square foot against a sell-out band of $351 to $547, sits between three $100 corrective deeds, and was followed ten weeks later by a $683,100 sale of the same home. Counted, it would report the building’s best result as +118.0%; the real round trip on that home is +6.7%.
How often do homes at Brickell Ten sell?
About one home in sixteen each year: 38 qualified sales across 2023, 2024, 2025 and 2026 to date, in 155 homes. That is reasonable turnover for the size, and enough that most of the six main floorplates have a recent comparable.
How big are the homes at Brickell Ten?
From 648 to 1,669 square feet, with a median of 940. Sixty-nine are two-bedrooms, 57 one-bedrooms and 29 three-bedrooms. Six floorplates cover 84 of the 155 homes at exactly fourteen apiece. The 2026 assessed values run $248,263 to $785,478, median $422,197.
Sources and further reading
Interested in selling in Brickell Ten?
Learn more about selling your condo in Brickell Ten with Josh Stein.
Thinking about Brickell Ten?
I have sold South Florida property since 2002, more than $1 billion of it. Ask me for the recorded declaration, what has genuinely closed, or a straight answer on whether this building fits what you are after.
Josh Stein · Florida real estate sales associate, license SL3057661 · (305) 695-8257 · hello@joshsteinrealtor.comRelated coverage
Part of Miami Luxury Condos.