

Journal · Miami Beach
147 home sales were recorded across 26 South of Fifth condominium buildings.
By Josh Stein · Florida license SL3057661 · Updated 13 November 2026
147 home sales were recorded across 26 South of Fifth condominium buildings in the 12 months to 22–24 September 2026, per the Miami-Dade County Property Appraiser record. Five Park South Beach had the most, 43, and Continuum South Beach 20.
Key Takeaways
- 147 home sales were recorded across 26 South of Fifth condominium buildings in the 12 months to the county pull of 22–24 September 2026, on the Miami-Dade County Property Appraiser record.
- Five Park recorded the most, 43 sales at a median of $3,500,000; it delivered recently, so its count includes first closings, per the Miami-Dade County Property Appraiser record pulled 22–24 September 2026.
- Continuum South Beach recorded 20 sales at a median of $4,875,000, or $3,014 per square foot, the highest per-foot median of any South of Fifth building with three or more sales, per the Miami-Dade County Property Appraiser record pulled 22–24 September 2026.
- Only 9 of the 26 buildings recorded three or more sales. 10 recorded one or two, and 7 recorded none, per the Miami-Dade County Property Appraiser record pulled 22–24 September 2026.
- Small buildings rarely trade. Several boutique buildings here have fewer than 30 homes; a year with no sale is normal for them and says nothing on its own about price.
- A recorded sale is a deed the county marks as a qualified, arm’s-length sale of a home in the building; related-party transfers, unqualified foreclosure deeds and single deeds that move several units at once are left out, per the Miami-Dade County Property Appraiser record pulled 22–24 September 2026.
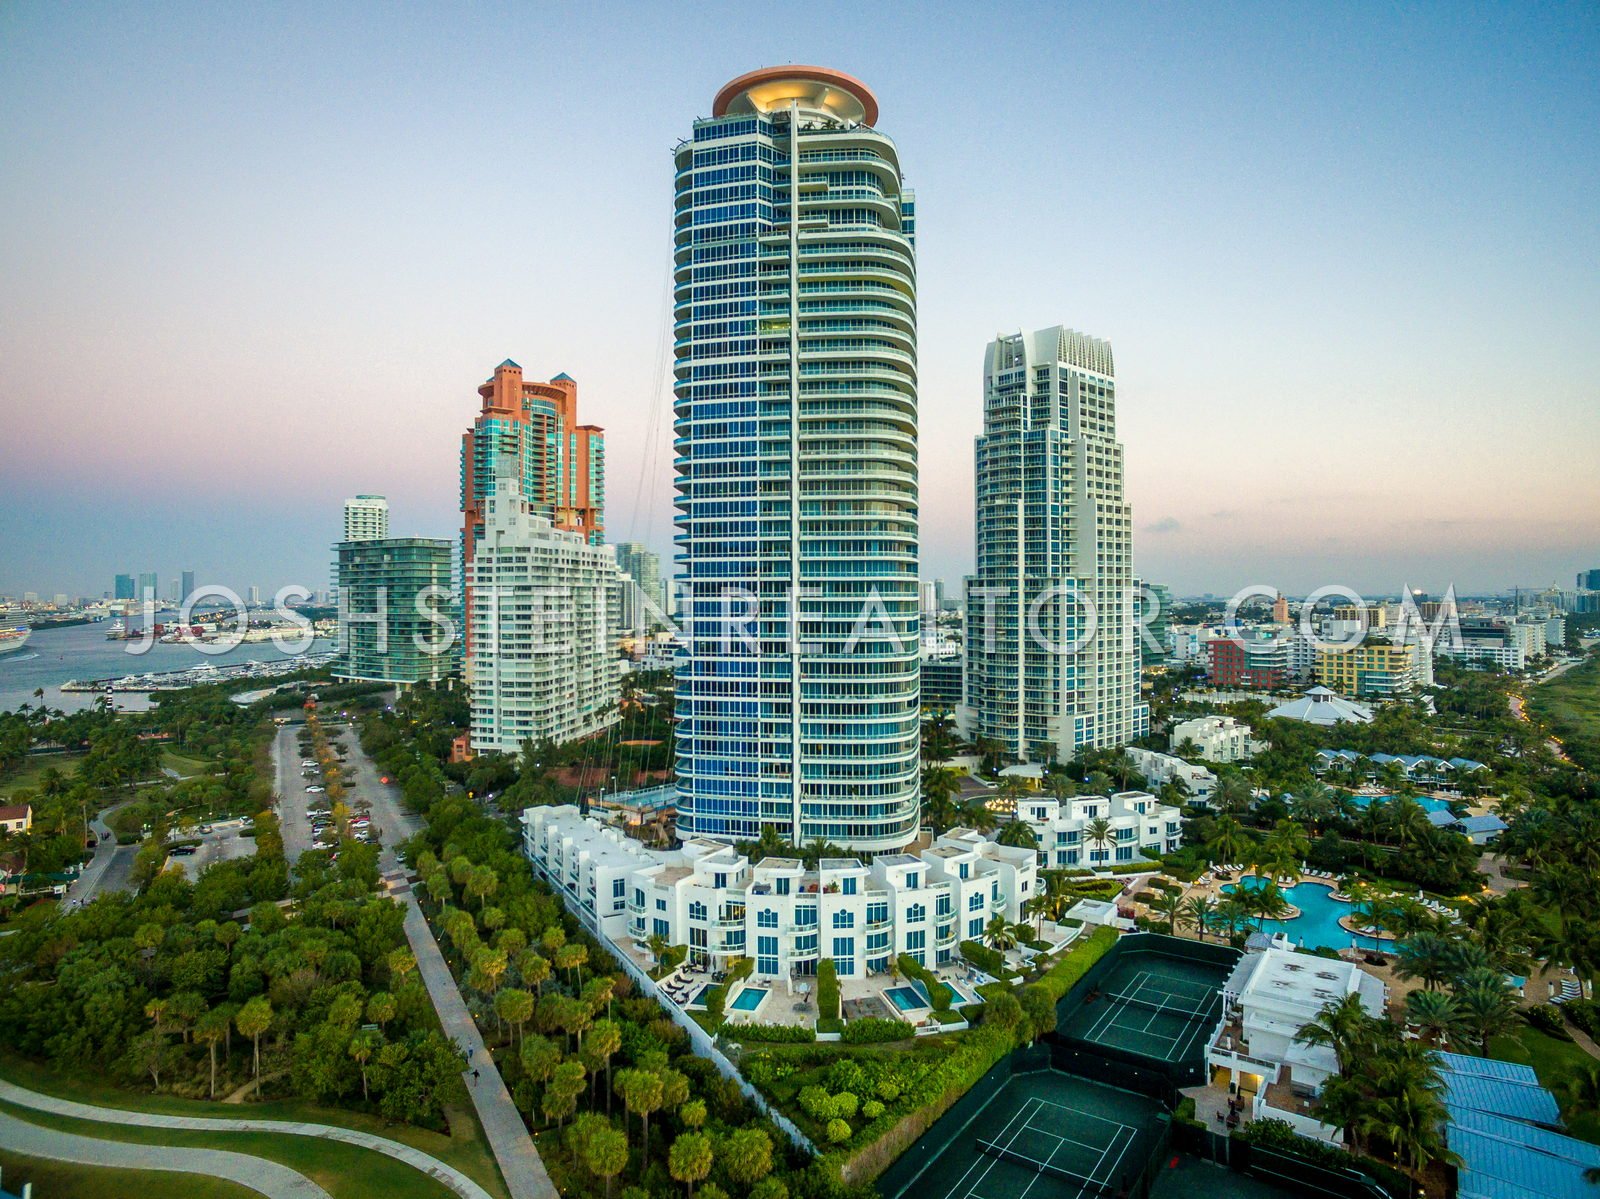
South of Fifth is small, expensive and thin: a handful of towers produce almost all of the sales, and the boutique buildings between them can go a year without one. That makes the record more useful here, not less, because a single listing can look like a market when it is not. This is the county record for every building JSR tracks in the South of Fifth neighborhood, for the 12 months to 22–24 September 2026.
Miami luxury picks
2555 listings


Listing information is deemed reliable but is not guaranteed and is provided exclusively for consumers' personal, non-commercial use. Data is supplied by the MLS and may be subject to change or withdrawal without notice.
Last updated November 13, 2026, 7:08 am
Five Park, the building with the most recorded sales here, has its own post-delivery buyer’s guide. For how often a condo changes hands in a typical building, see how often a Miami condo actually trades. On the news side, JSR has covered the plan for the Savoy Hotel on Ocean Drive.
How these numbers are counted
Every figure here comes from the Miami-Dade County Property Appraiser’s public record, pulled by JSR on 22–24 September 2026. A “sale” is a deed the county marks as a qualified, arm’s-length sale of a home in the building. Transfers between related parties, foreclosure deeds the county does not qualify, and single deeds that move several units at once are left out, because one package price split across units would distort the picture.
The window is the 12 months before each building’s county pull. We publish the count, the median price, the median price per square foot and the date of the latest recorded sale. We do not publish a low-to-high range: one package deed can make a range meaningless while barely moving a median. Where a building recorded one or two sales, there is no median; two sales are not a market.
These are the same figures that appear at the top of each building’s page on this site. They are recorded closings, not asking prices, and the record lags the closing table by a few weeks.
Every South of Fifth building, last 12 months
Sorted by the number of recorded sales. Source: Miami-Dade County Property Appraiser, pulled 22–24 September 2026.
| Building | Sales recorded, last 12 months | Median price | Median $ per sq ft | Latest recorded sale |
|---|---|---|---|---|
| Five Park South Beach | 43 | $3,500,000 | $1,733 | 13 July 2026 |
| Continuum South Beach | 20 | $4,875,000 | $3,014 | 25 June 2026 |
| The Yacht Club at Portofino | 17 | $870,000 | $1,000 | 7 July 2026 |
| Icon South Beach | 13 | $3,210,000 | $1,702 | 23 June 2026 |
| Murano at Portofino | 12 | $3,200,000 | $1,919 | 10 June 2026 |
| Portofino Tower | 11 | $3,100,000 | $1,517 | 24 July 2026 |
| Murano Grande | 9 | $2,625,000 | $1,625 | 8 May 2026 |
| The Cosmopolitan | 7 | $710,000 | $865 | 15 April 2026 |
| One Ocean | 3 | $3,850,000 | $1,885 | 2 July 2026 |
| Marea | 2 | too few | n/a | 15 May 2026 |
| Ocean Place | 2 | too few | n/a | 23 January 2026 |
| 321 Ocean | 1 | too few | n/a | 11 November 2025 |
| Absolut Lofts | 1 | too few | n/a | 8 December 2025 |
| Ilona Lofts | 1 | too few | n/a | 26 February 2026 |
| Manhattan Lofts | 1 | too few | n/a | 7 October 2025 |
| Meridian 5 Lofts | 1 | too few | n/a | 28 October 2025 |
| Ocean House | 1 | too few | n/a | 10 June 2026 |
| The Ambassadors | 1 | too few | n/a | 17 November 2025 |
| Three Hundred Collins | 1 | too few | n/a | 13 May 2026 |
| 350 Meridian | 0 | no sale | n/a | 20 December 2023 |
| Glass Miami Beach | 0 | no sale | n/a | 15 May 2024 |
| Ocean Five | 0 | no sale | n/a | 17 November 2021 |
| Ocean Park South Beach | 0 | no sale | n/a | 3 March 2023 |
| Sundance Lofts | 0 | no sale | n/a | 30 May 2023 |
| The Courts Miami Beach | 0 | no sale | n/a | 2 March 2025 |
| The Neville | 0 | no sale | n/a | 21 March 2025 |
The oceanfront at South Pointe
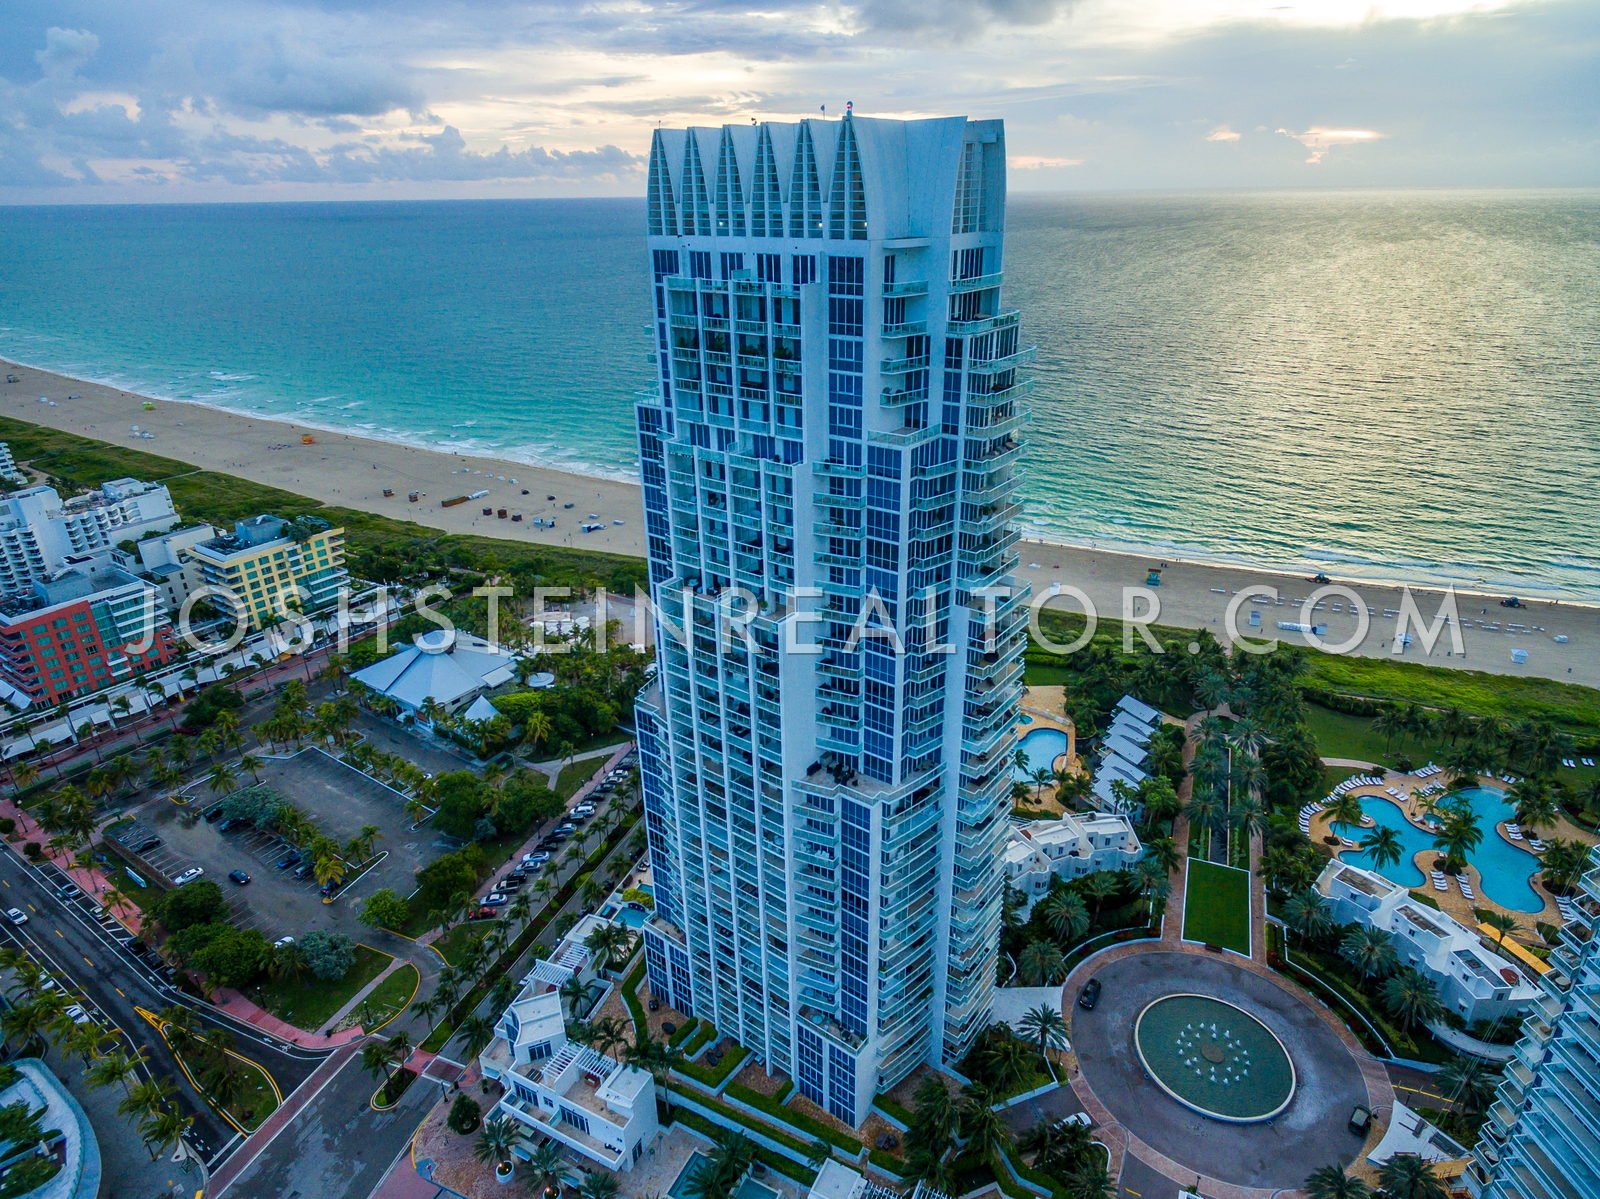
On the county record pulled 22–24 September 2026, Continuum South Beach recorded 20 sales at a median of $4,875,000 ($3,014 per square foot). One Ocean recorded 3 sales at a median of $3,850,000 ($1,885 per square foot). Ocean House recorded 1 sale. 321 Ocean recorded 1 sale.
Portofino and the Government Cut side
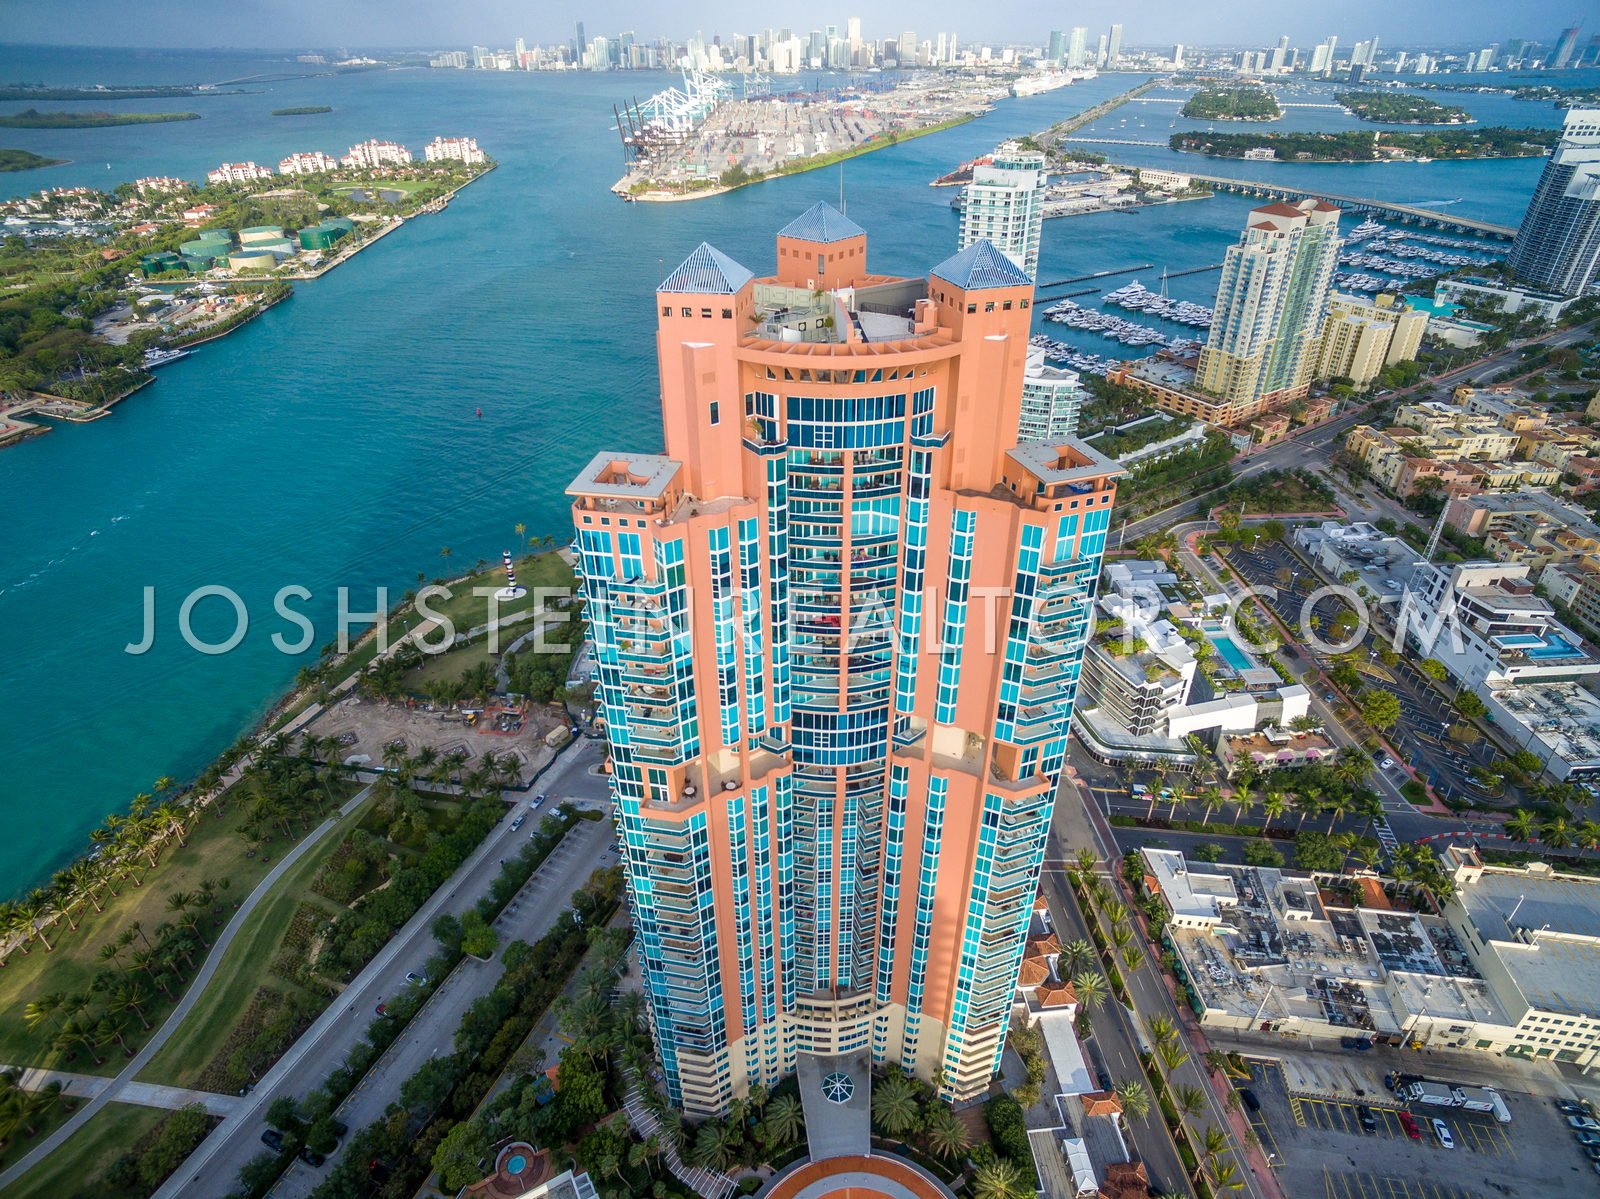
Portofino Tower recorded 11 sales at a median of $3,100,000 ($1,517 per square foot). Murano at Portofino recorded 12 sales at a median of $3,200,000 ($1,919 per square foot). Murano Grande recorded 9 sales at a median of $2,625,000 ($1,625 per square foot). The Yacht Club at Portofino recorded 17 sales at a median of $870,000 ($1,000 per square foot).
West Avenue and Alton Road
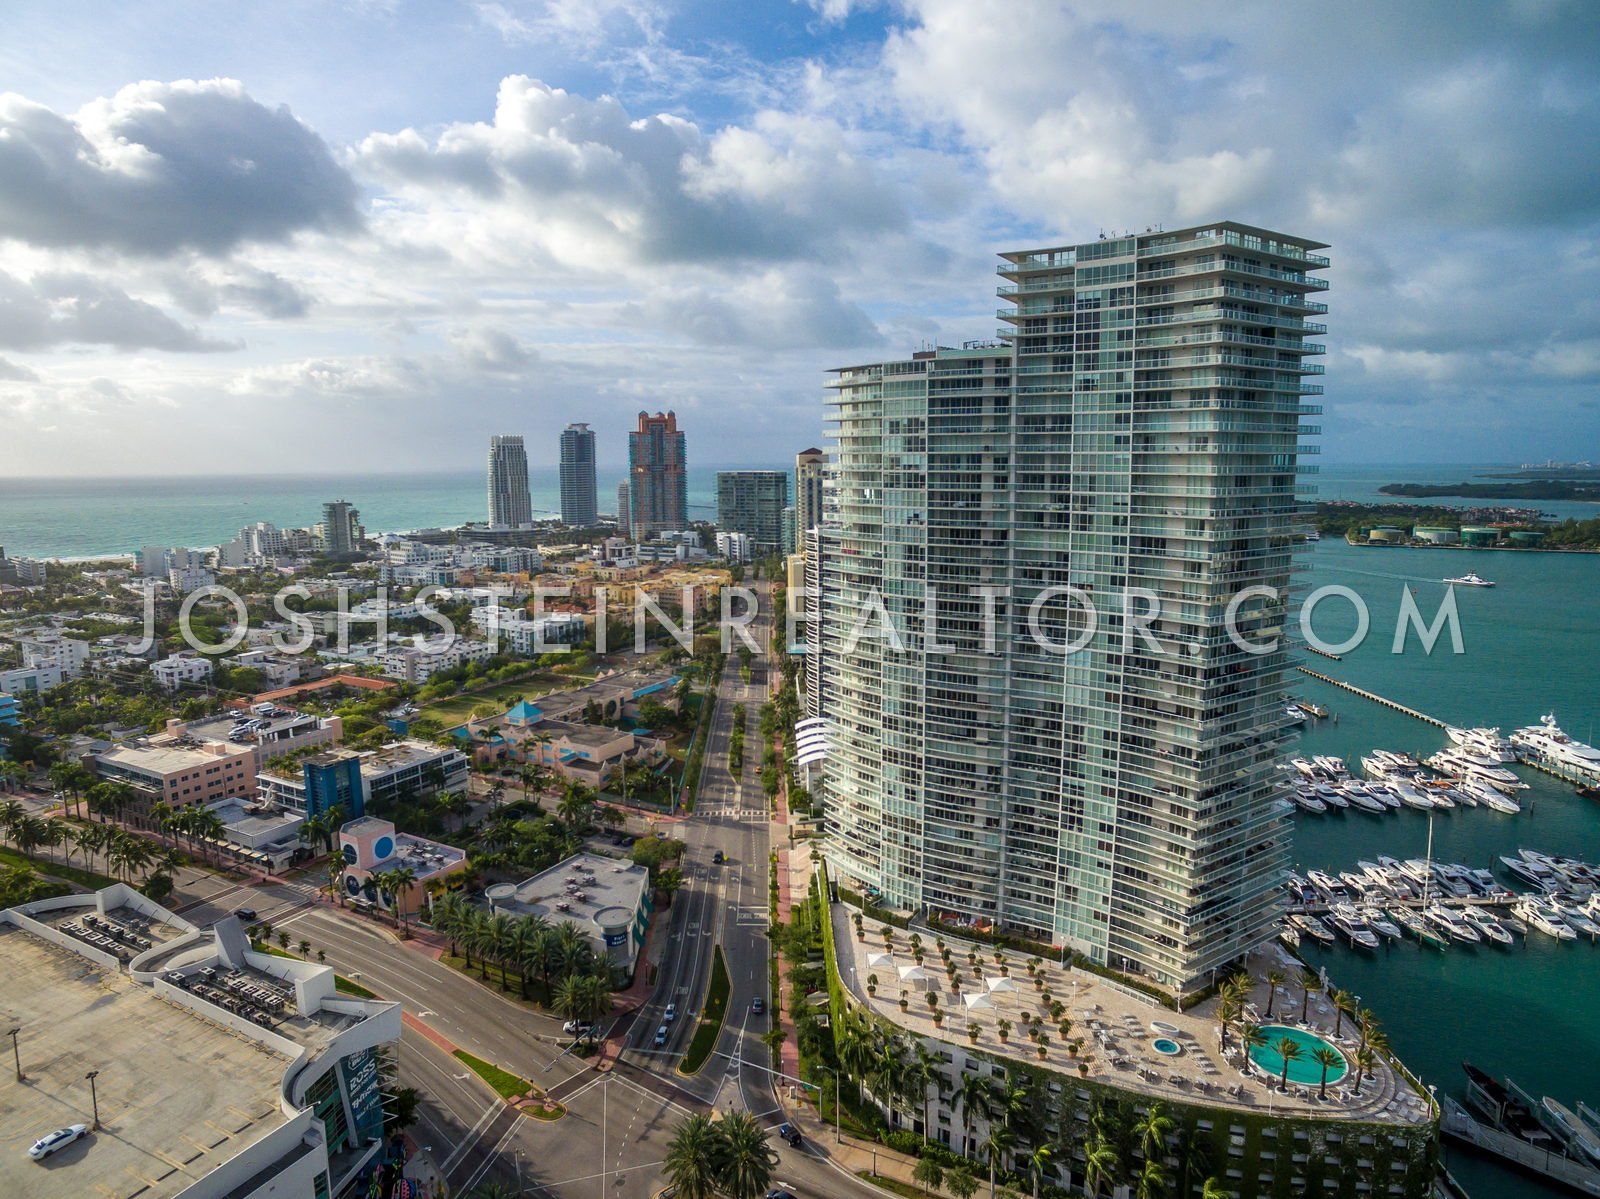
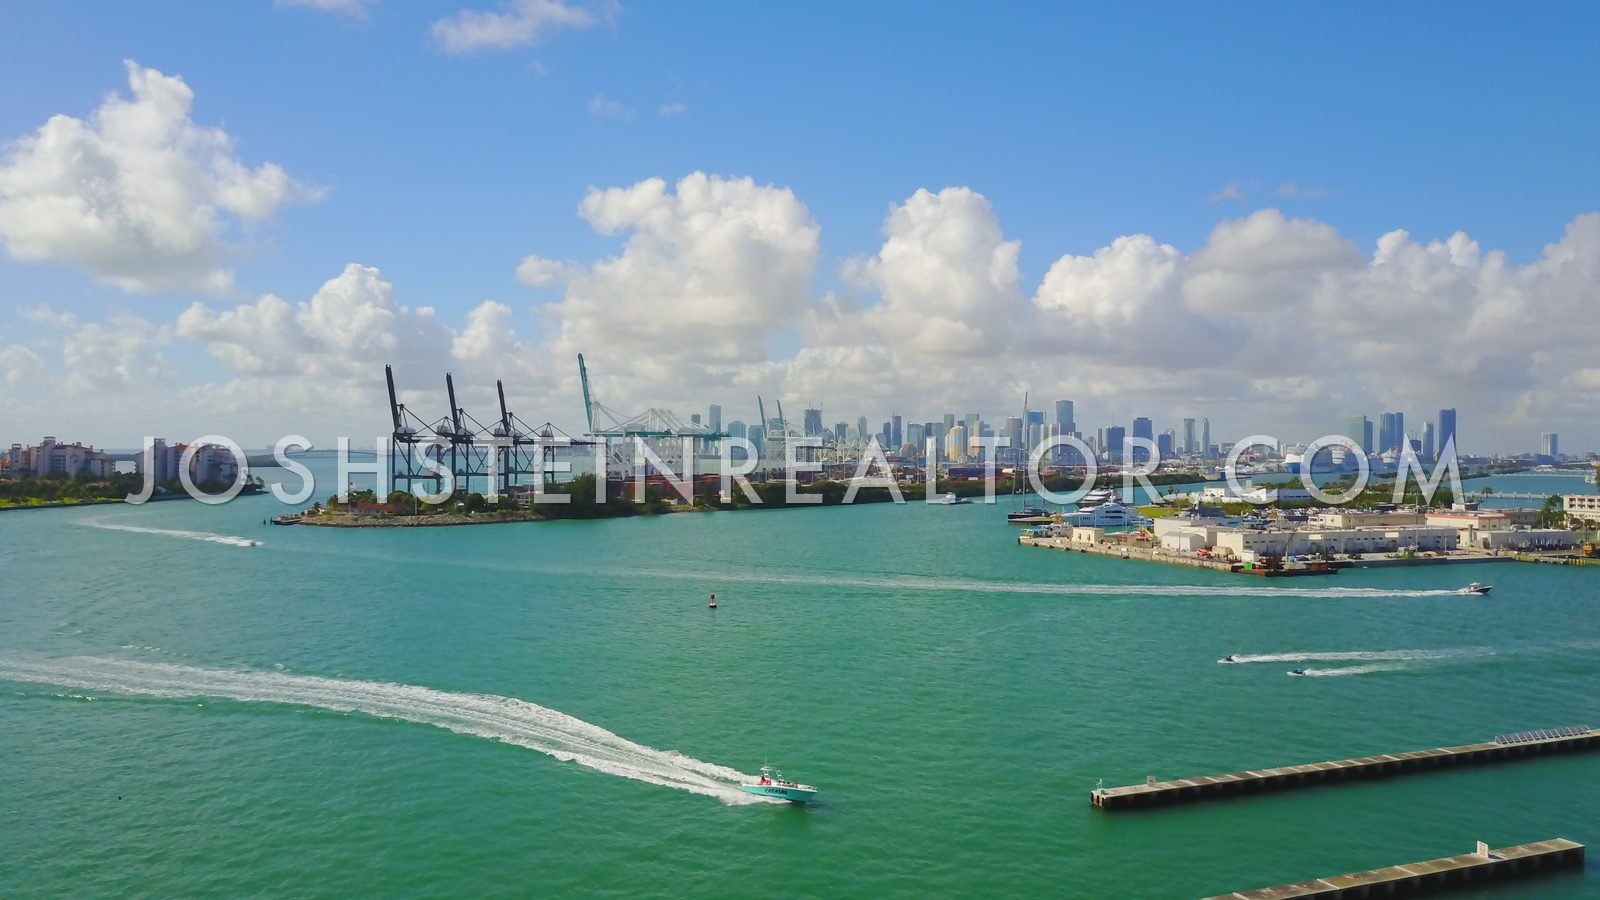
Icon South Beach recorded 13 sales at a median of $3,210,000 ($1,702 per square foot). Five Park South Beach recorded 43 sales at a median of $3,500,000 ($1,733 per square foot). Five Park’s count covers the building as a whole and, because it delivered recently, includes first closings; see the Five Park page for its delivery record.
When a building shows no sale
350 Meridian, The Courts Miami Beach, Glass Miami Beach, Ocean Five, Ocean Park South Beach, Sundance Lofts, The Neville recorded no qualified sale in the window. Most of them are small: a building of a dozen homes can easily go a year without one. For an owner in a building like that, the useful comparison is the nearest buildings of the same type and age, adjusted for size and view, and the building’s own older sales, which are on the record too.
For the neighborhood view, see the South of Fifth neighborhood page, and for the rest of the island, Miami Beach.
County record pulled 22–24 September 2026. Counts and medians are recorded closings, not asking prices.
Own in South of Fifth? Ask what yours would sell for
These are recorded closings, not asking prices. Message Josh on WhatsApp or call (305) 695-8257: tell him the building and the unit, and he’ll send the county record for your line and what it says about your home.
WhatsApp Josh Call (305) 695-8257 Did owners in my building make money?
South of Fifth condo sales: common questions
How many condo sales were recorded in South of Fifth in the last 12 months?
The Miami-Dade County Property Appraiser record pulled 22–24 September 2026 shows 147 home sales across the 26 South of Fifth condominium buildings JSR tracks in the 12 months to those dates.
Which South of Fifth condo building had the most sales?
On the Miami-Dade County Property Appraiser record pulled 22–24 September 2026, Five Park South Beach recorded 43 sales at a median of $3,500,000 ($1,733 per square foot), the latest on 13 July 2026; because it delivered recently, its count includes first closings.
Which South of Fifth building has the highest median price per square foot?
On the Miami-Dade County Property Appraiser record pulled 22–24 September 2026, Continuum South Beach recorded 20 sales at a median of $4,875,000, or $3,014 per square foot, the highest per-foot median of any South of Fifth building with three or more sales.
What do condos at Portofino sell for?
On the Miami-Dade County Property Appraiser record pulled 22–24 September 2026, Portofino Tower recorded 11 sales at a median of $3,100,000 ($1,517 per square foot), Murano at Portofino 12 sales at $3,200,000 ($1,919), Murano Grande 9 at $2,625,000 ($1,625) and The Yacht Club at Portofino 17 at $870,000 ($1,000).
Which South of Fifth buildings recorded no condo sales in the last 12 months?
On the Miami-Dade County Property Appraiser record pulled 22–24 September 2026, 7 of the 26 buildings recorded none: 350 Meridian, The Courts Miami Beach, Glass Miami Beach, Ocean Five, Ocean Park South Beach, Sundance Lofts and The Neville; most are small, and a building of a dozen homes can easily go a year without a sale.
Why do some South of Fifth buildings show no median price?
JSR prints no median where a building recorded one or two sales, and on the Miami-Dade County Property Appraiser record pulled 22–24 September 2026, 10 of the 26 buildings recorded one or two.
What counts as a sale in these figures?
On the Miami-Dade County Property Appraiser record pulled 22–24 September 2026, a sale is a deed the county marks as a qualified, arm’s-length sale of a home in the building; transfers between related parties, foreclosure deeds the county does not qualify and single deeds that move several units at once are left out, and the figures are recorded closings, not asking prices.
Does this cover every condo building in South of Fifth?
It is the county record for every South of Fifth building JSR tracks: 26 buildings, each with a row in the table, on the Miami-Dade County Property Appraiser record pulled 22–24 September 2026.
How has your building held its value? The Miami Condo Index ranks Miami condo buildings by their county sale records: real price per square foot, turnover and four-year change.