

Journal · Miami Luxury Condos Blog
Of 130 Miami-Dade condo resales dated 26 June to 21 August 2026, 25 (19.2%) closed below the previous recorded sale.
By Josh Stein · Florida license SL3057661 · Updated 29 October 2026
Key Takeaways
- Of 130 Miami-Dade condo resales dated 26 June to 21 August 2026, 25 (19.2%) closed below the previous recorded sale and 105 closed above it, per Miami-Dade County Property Appraiser qualified sales, retrieved September 2026.
- The median change across all 130 resales was +27.4%.
- The largest dollar gap was -$1,122,000 at Oceana Bal Harbour.
- The record covers late June to August only: 99 of the 130 resales are dated July and 5 are dated August; the newest posted sale is dated 21 August.
- The county posts sales weeks after they close, so later sales are still being added. Treat this as the record so far, not a full quarter.
- The edition tracks more than 400 Miami-Dade condo buildings, about 83,000 homes.
Of 130 Miami-Dade condo resales dated 26 June to 21 August 2026, 25 (19.2%) closed below the previous recorded sale and 105 closed above it; the median change across all 130 was +27.4%. The largest dollar gap was -$1,122,000 at Oceana Bal Harbour. Source: Miami-Dade County Property Appraiser qualified sales, retrieved September 2026.
Recorded condo losses, edition 1

Every condo sale in Miami-Dade lands in the public record. This series reads that record and lists the resales that closed below the price the home last sold for. Nothing here is a guess or an asking price. It is what the county recorded.
In this edition we looked at 130 resales with sale dates from June 26 to August 21, 2026, across the more than 400 Miami-Dade condo buildings we track (about 83,000 homes), using Miami-Dade County Property Appraiser qualified sales retrieved in September 2026. 25 of the 130 sold for less than the previous recorded sale, or 19.2%. The other 105 sold for more.


Listing information is deemed reliable but is not guaranteed and is provided exclusively for consumers' personal, non-commercial use. Data is supplied by the MLS and may be subject to change or withdrawal without notice.
Last updated November 13, 2026, 9:54 pm
One caution up front. The county posts sales weeks after they close. When we pulled the record, 99 of the 130 resales were dated July, only 5 were dated August, and the newest sale the county had posted was dated August 21. Later sales are still being posted, so treat this as the record so far for late June through August, not a full quarter.
The 10 largest recorded losses, in dollars
Source: Miami-Dade County Property Appraiser, qualified sales, retrieved September 2026. “Bought” is the previous qualified sale of the same home. Size is the county’s living-area figure. Held is the time between the two sales.
| Building | Size | Bought | Sold | Difference | Held |
|---|---|---|---|---|---|
| Oceana Bal Harbour | 4,977 sq ft | 2023, $22,000,000 | Jul 2026, $20,878,000 | -$1,122,000 (-5.1%) | 3.1 yrs ¹ |
| Epic Residences | 4,310 sq ft | 2022, $4,450,000 | Jul 2026, $4,125,000 | -$325,000 (-7.3%) | 3.8 yrs |
| Paramount Miami Worldcenter | 1,254 sq ft | 2019, $963,000 | Jun 2026, $645,000 | -$318,000 (-33.0%) | 6.8 yrs ² |
| Vizcayne North | 1,363 sq ft | 2008, $937,000 | Jul 2026, $625,000 | -$312,000 (-33.3%) | 17.6 yrs ² |
| One Thousand Museum | 4,600 sq ft | 2022, $7,300,000 | Jul 2026, $7,000,000 | -$300,000 (-4.1%) | 4.2 yrs |
| W South Beach | 1,543 sq ft | 2012, $1,800,000 | Jul 2026, $1,500,000 | -$300,000 (-16.7%) | 14.2 yrs |
| 400 Sunny Isles | 1,732 sq ft | 2022, $1,370,000 | Jul 2026, $1,150,000 | -$220,000 (-16.1%) | 3.9 yrs |
| Opera Tower | 825 sq ft | 2013, $431,000 | Jun 2026, $280,000 | -$151,000 (-35.0%) | 12.8 yrs |
| Monad Terrace | 1,324 sq ft | 2022, $2,000,000 | Jul 2026, $1,850,000 | -$150,000 (-7.5%) | 4.2 yrs |
| Gran Paraiso | 1,649 sq ft | 2019, $1,472,900 | Jul 2026, $1,325,000 | -$147,900 (-10.0%) | 7.5 yrs |
¹ This home is the west half of a split penthouse; the county records each half as a separate home. The buyer already owned the east half.
² Between the two sales, the title passed once for $100 (to a company in one case, a foundation in the other). That is not a sale, so “Bought” is the last open-market price.
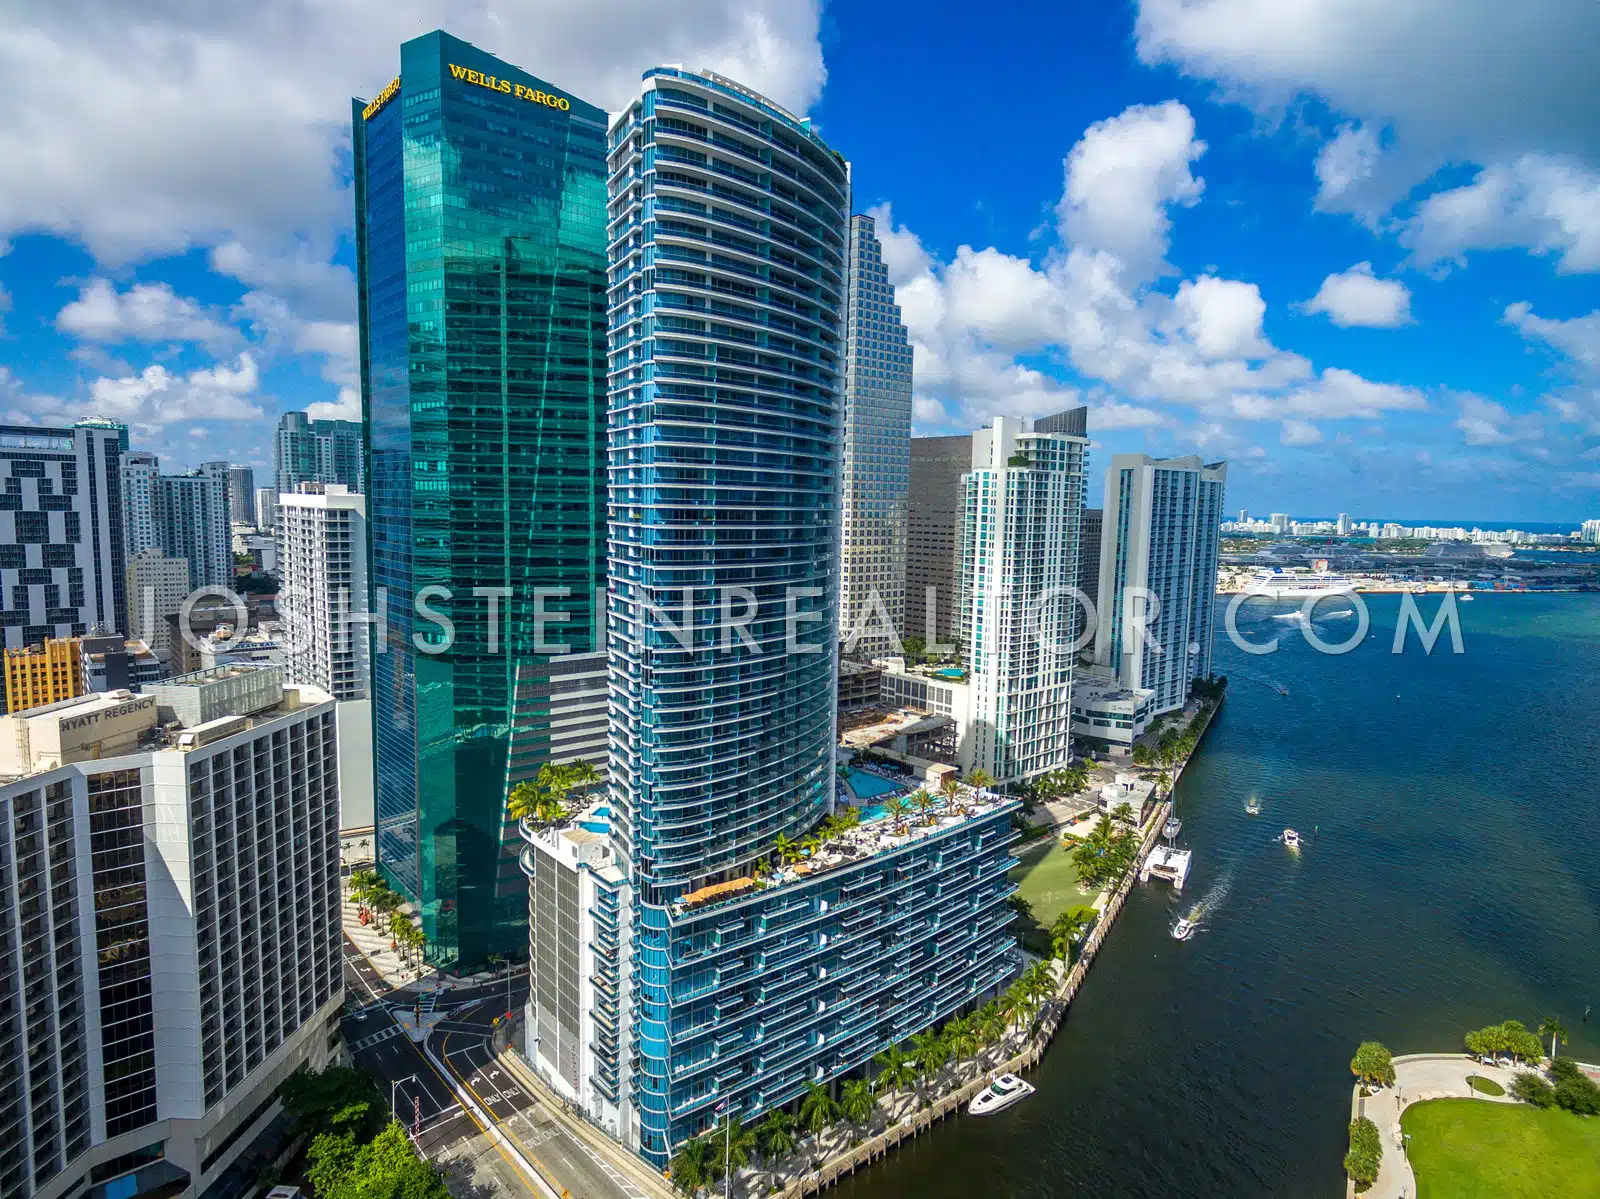
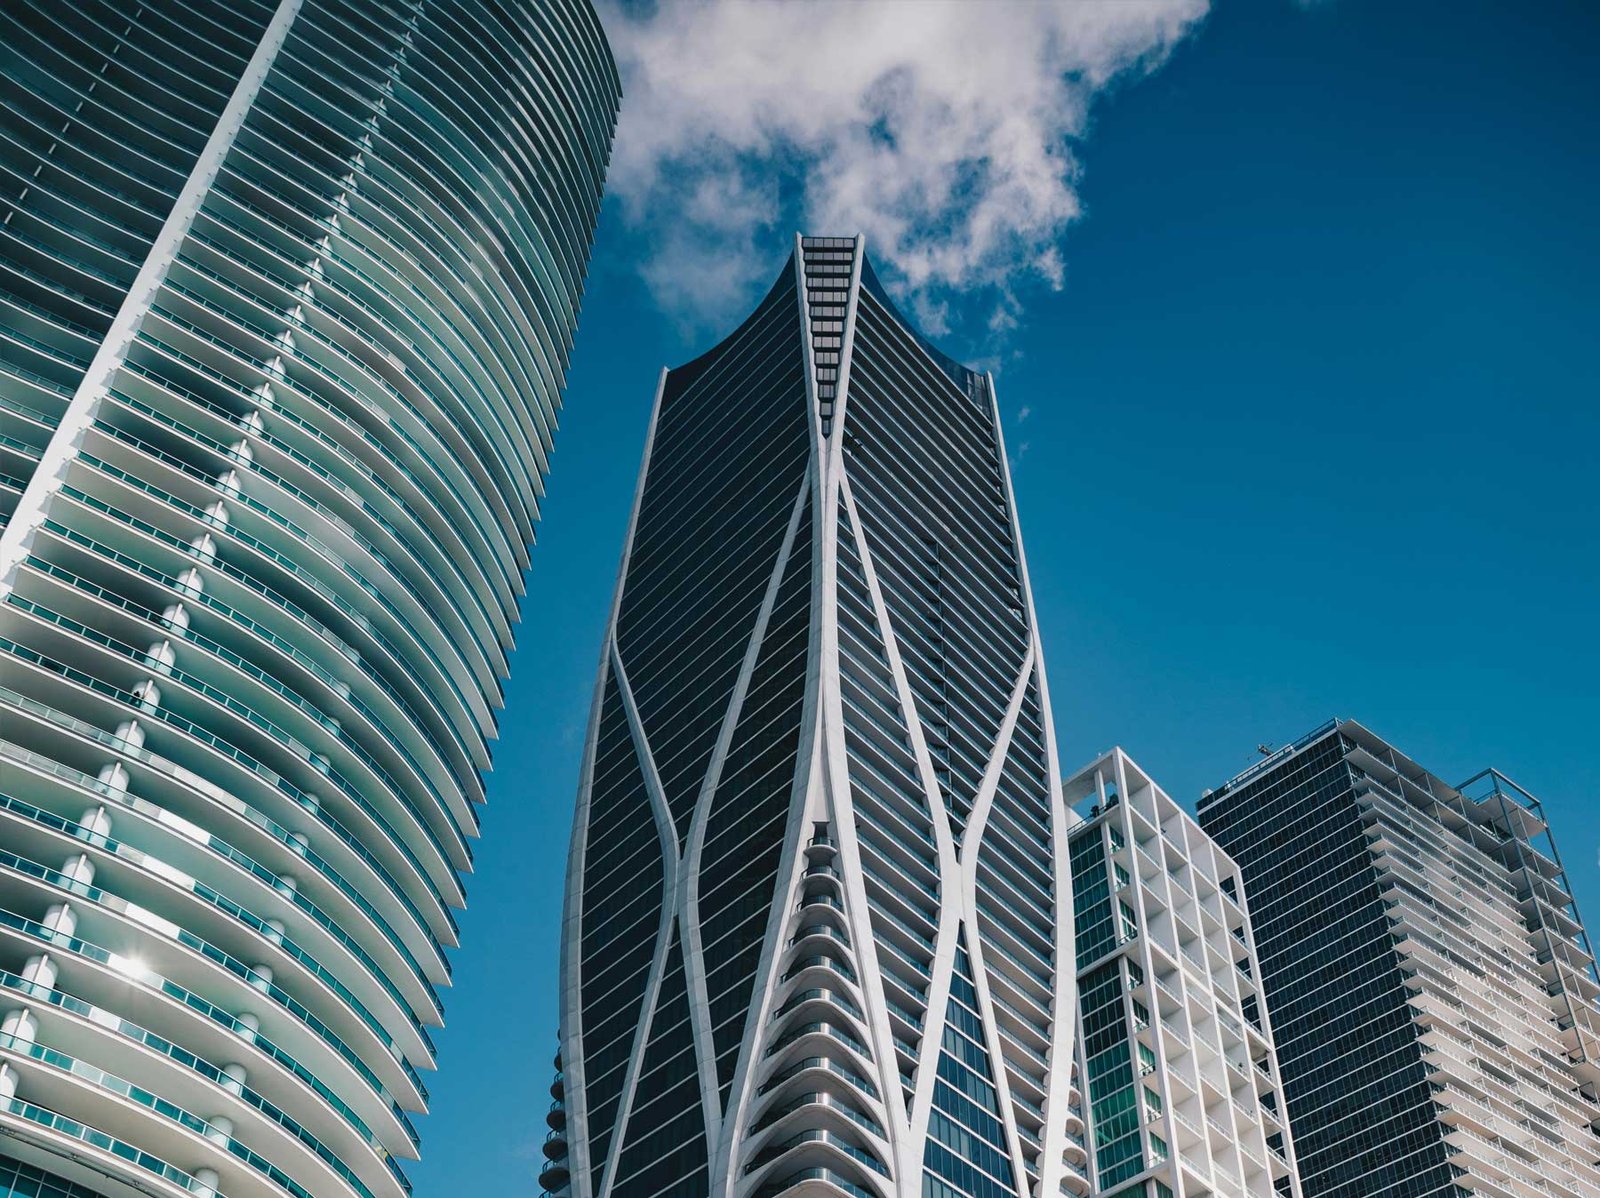
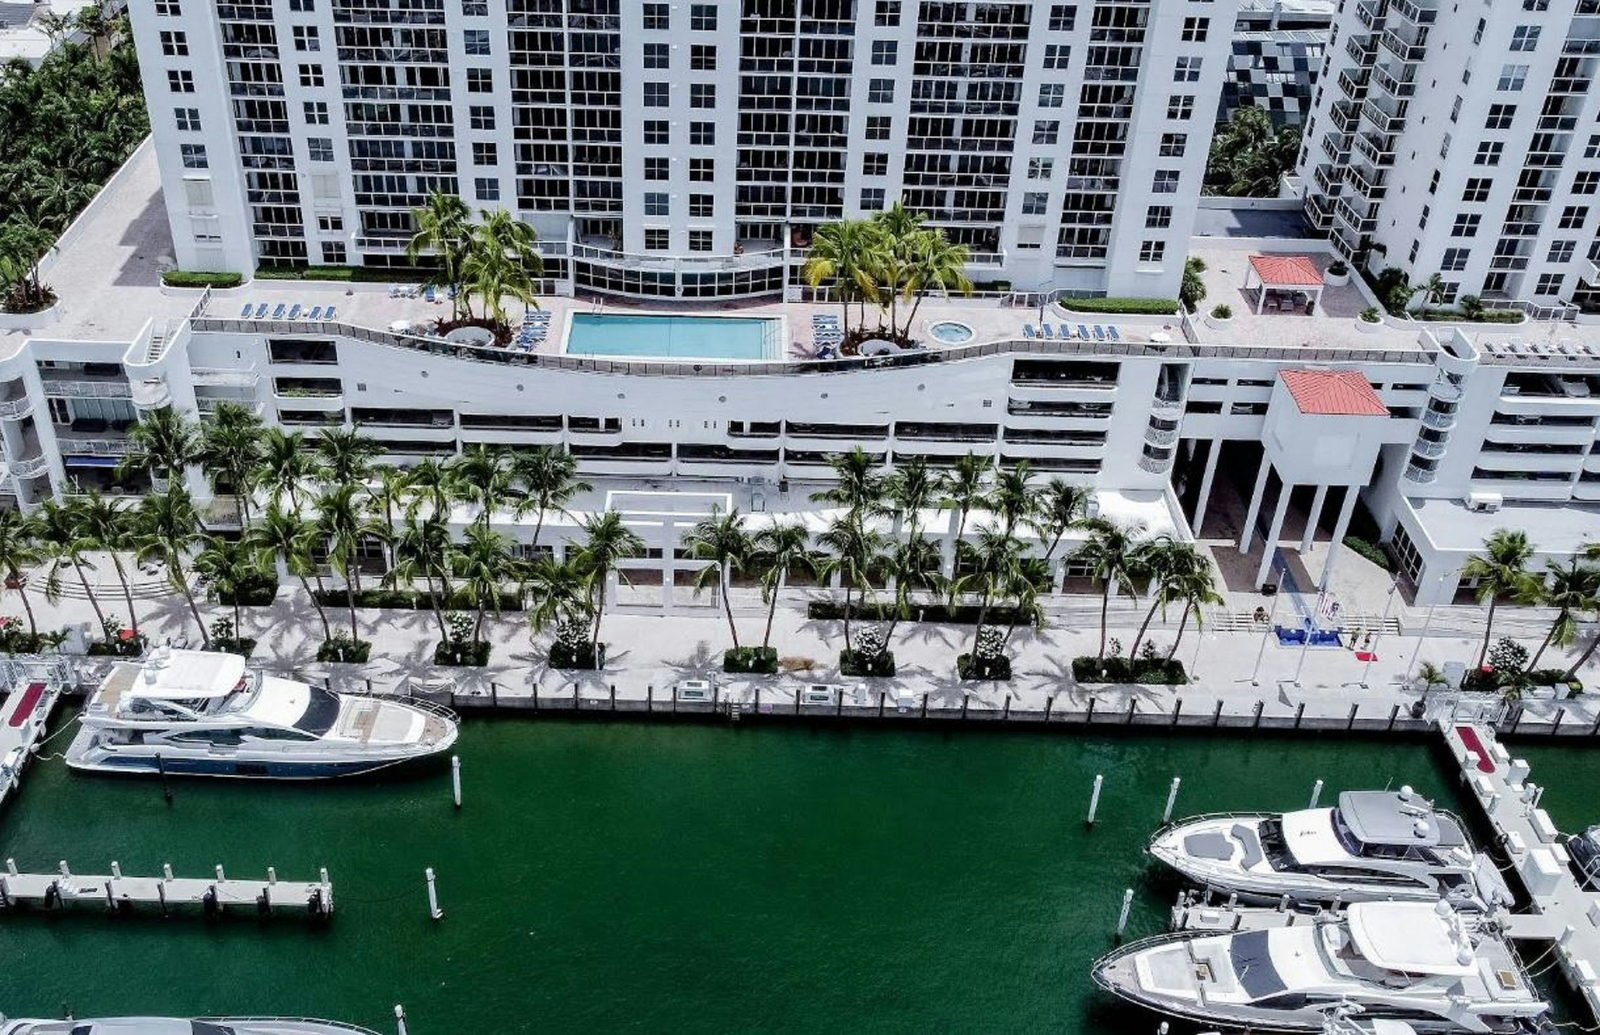
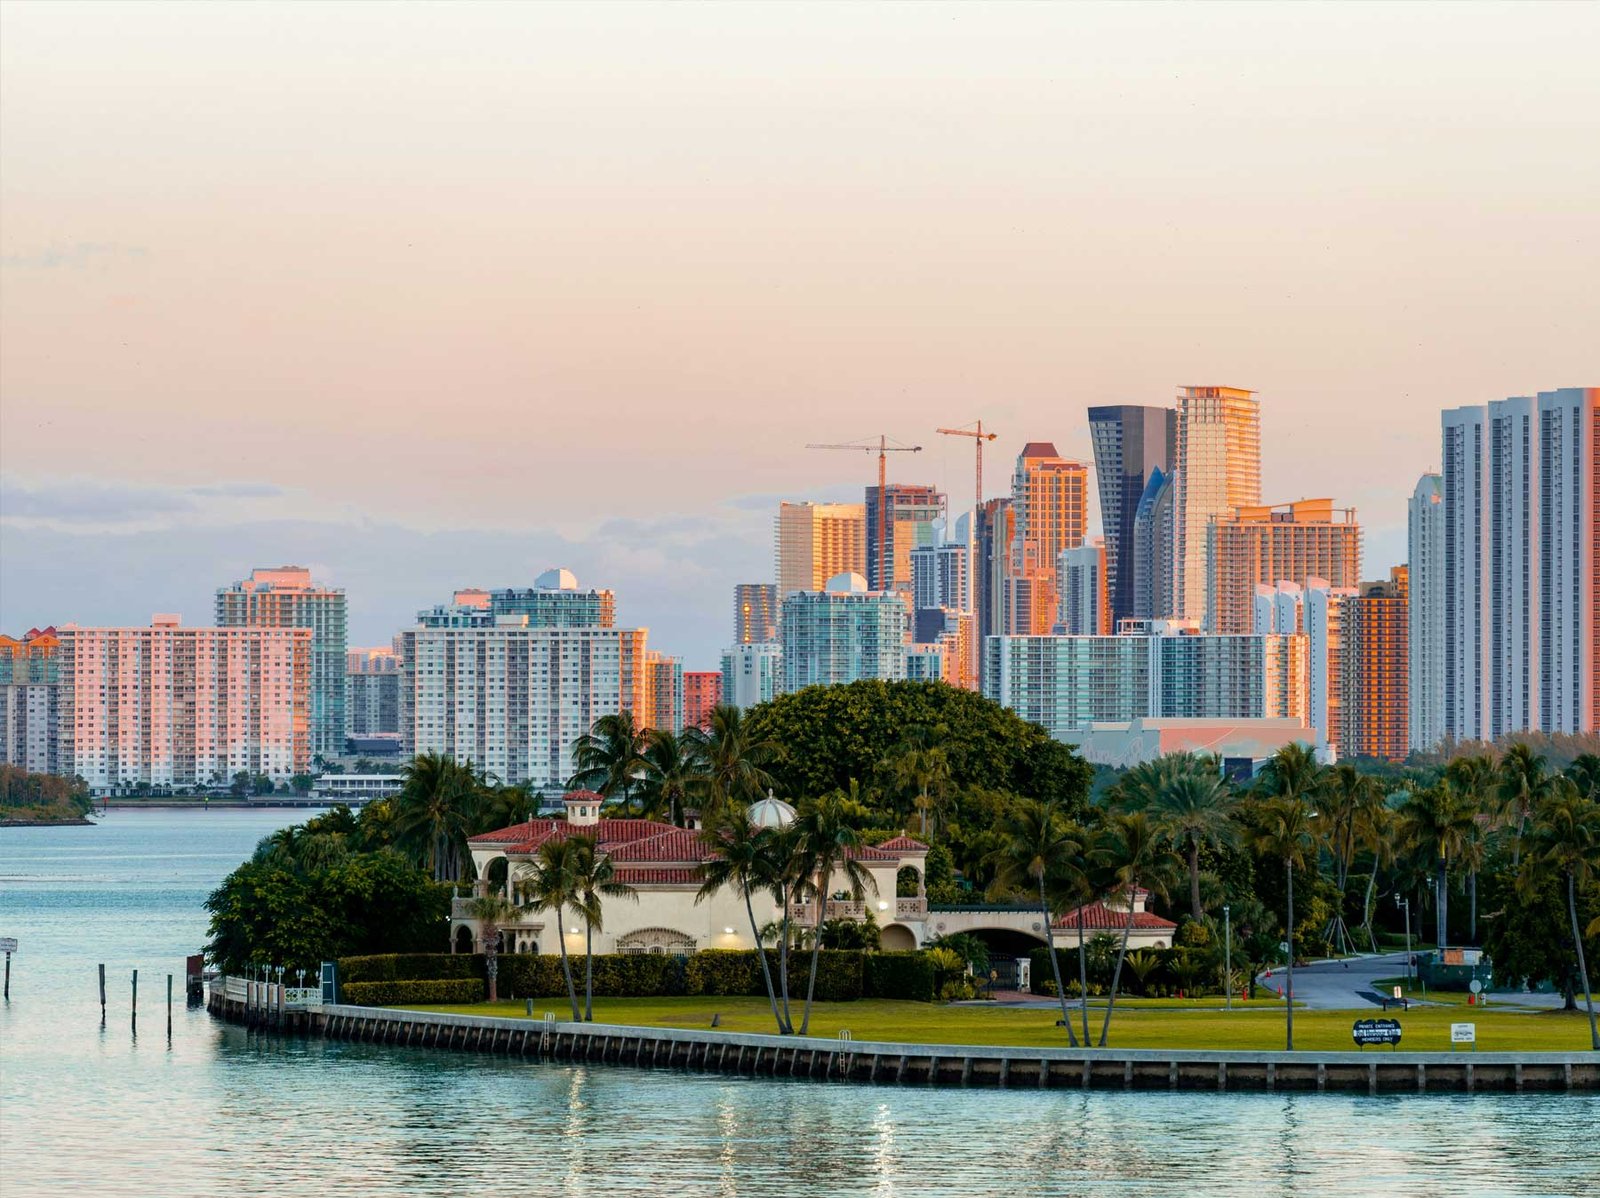
Where the top 10 are

What the numbers show
- Losses clustered in 2022 and 2023 purchases. Of the 27 resales of homes bought in 2022 or 2023, 12 sold for less (44%). Of the 86 resales of homes bought before 2022, 9 sold for less (10%), and none of the 24 homes bought in 2020 or 2021 did.
- The biggest dollar gap was not the steepest. The largest gap, $1,122,000 at Oceana Bal Harbour, was 5.1% of the purchase price. The three steepest, 33% to 35%, were homes bought in 2008, 2013 and 2019.
- Most resales still sold for more. The median change across all 130 resales was a gain of 27.4%. Among the 25 that sold for less, the median gap was 7.3%.
- Shorter holds were more common among the losses. The median hold was 4.2 years for the 25 losses and 6.0 years for all 130 resales.
The figures above describe past sales only. They say nothing about why any owner sold, and they are not advice on buying or selling any home.
How we count
- Source: Miami-Dade County Property Appraiser sales records for the condo buildings we track, retrieved September 2026 (pulls dated September 14 to 26).
- Sales: only sales the county marks “qualified,” its label for open-market sales. Sales under $100,000 are left out.
- A resale is two qualified sales in a row on the same home. It counts as a loss when the later price is lower. Transfers between related parties for a nominal price (such as $100) are not sales and are skipped.
- Left out: any sale whose price and date match another home’s (possible bulk deed), sales after a foreclosure or bank transfer, pairs where a priced transfer sits between the two sales, and pairs less than six months apart. 40 pairs were left out this way.
- Window: the later sale is dated June 26 to September 23, 2026; the newest sale the county had posted was dated August 21. The county posts sales with a delay, so recent weeks are incomplete.
- Not included: closing costs, renovations, commissions, taxes or fees. These are recorded prices, not profit or loss to any person.
Corrections: If a figure here is wrong, email hello@joshsteinrealtor.com.
Condo resales that sold for less: common questions
How many Miami condo resales closed below the previous sale?
25 of the 130 resales, or 19.2%, sold for less than the previous recorded sale. The other 105 sold for more. The resales have sale dates from June 26 to August 21, 2026.
Which resale lost the most dollars?
The largest gap, $1,122,000 at Oceana Bal Harbour, was 5.1% of the purchase price.
Is this a full quarter?
No. The county posts sales weeks after they close. When we pulled the record, 99 of the 130 resales were dated July, only 5 were dated August, and the newest sale the county had posted was dated August 21. Treat this as the record so far for late June through August, not a full quarter.
How has your building held its value? The Miami Condo Index ranks Miami condo buildings by their county sale records: real price per square foot, turnover and four-year change.