

Journal · Miami Luxury Condos Blog
Fisher Island has the cleanest resale record.
By Josh Stein · Florida license SL3057661 · Updated 26 September 2026
 By Josh Stein — Miami real estate sales associate, Florida license SL3057661. Selling Miami luxury property since 2002, with more than $1 billion closed.
Across nine Miami neighbourhoods, the share of condominium resales that sold for less than the owner paid runs from 1 per cent to 43.9 per cent. Fisher Island is the lowest; North Bay Village is the highest. I took every round-trip sale the Miami-Dade County Property Appraiser records in the buildings I track and counted them.
A round trip is the only honest test of a condo market. An asking price is a hope and a single closing is one data point, but the same home bought and later sold tells you what actually happened to somebody’s money. Here is what the record says — and why the obvious reading of it is wrong.
Key Takeaways
- Fisher Island has the cleanest resale record of the nine — 193 round trips, two of which lost money, and a median gain of 125.5 per cent.
- North Bay Village has the weakest — 43.9 per cent of its 428 recorded round trips sold below what the owner paid.
- The pattern is holding period, not quality. The three weakest neighbourhoods are dominated by recently delivered towers, where resales have had only a few years to move.
- Loss rate and median gain move in opposite directions, exactly as short holds would predict: 43.9 per cent losses against a 5.5 per cent median gain in North Bay Village, 1 per cent against 125.5 per cent on Fisher Island.
- None of it is adjusted for inflation, carrying costs, assessments or commissions — a small recorded gain can still have been a real loss.
- Sample sizes differ sharply. Coconut Grove rests on six buildings and 893 homes; the Upper Eastside on one building and 43.
What the county record actually shows
Every figure below is a round trip: the same folio bought, then sold again, with both transactions recorded and qualified on the Miami-Dade roll. Unqualified transfers — quit claims, intra-family reorganisations, deeds in lieu of foreclosure — are excluded, because a $100 transfer between two companies is not a sale.
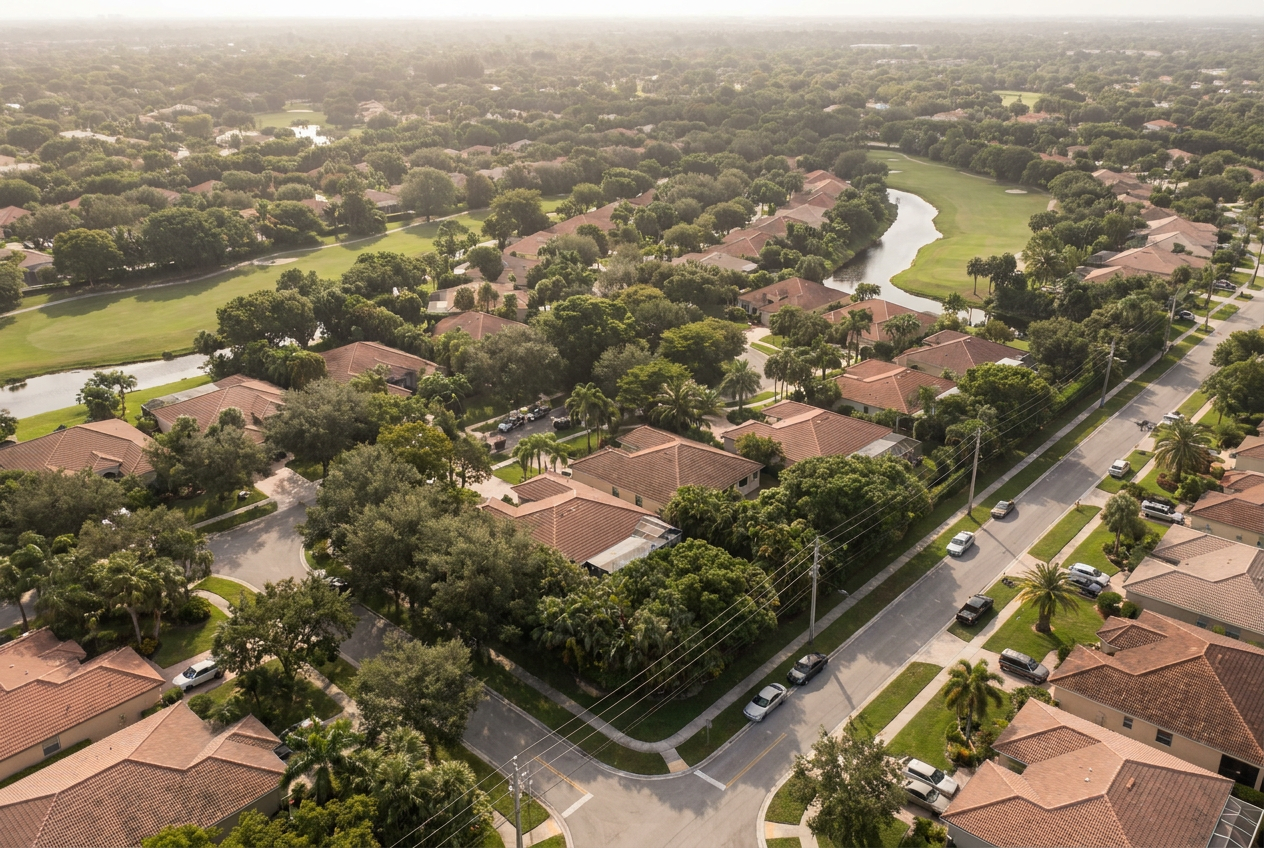
Fisher Island and Coral Gables, in the deeper red, are the two tightest records in the set.
| Neighbourhood | Buildings | Homes | Recorded resales | Lost money | Median change |
|---|---|---|---|---|---|
| North Bay Village | 6 | 544 | 428 | 43.9% | +5.5% |
| Design District | 2 | 205 | 105 | 39.0% | +8.6% |
| North Miami Beach | 1 | 470 | 269 | 32.0% | +10.3% |
| Surfside | 6 | 407 | 234 | 8.1% | +83.4% |
| Coconut Grove | 6 | 893 | 741 | 6.3% | +118.2% |
| Upper Eastside | 1 | 43 | 34 | 5.9% | +52.4% |
| Key Biscayne | 3 | 289 | 200 | 4.5% | +72.7% |
| Coral Gables | 4 | 474 | 241 | 2.1% | +74.8% |
| Fisher Island | 1 | 234 | 193 | 1.0% | +125.5% |
The spread is the story. A buyer choosing between two Miami condominiums on price per square foot alone would see nothing to separate these places. The resale record separates them by a factor of forty.
Why is North Bay Village at the bottom?
The tempting conclusion — that North Bay Village is simply a bad market and Fisher Island a good one — is mostly wrong, and the last column of the table is what gives it away.
Each dot is a neighbourhood. The relationship runs the wrong way for the “good market, bad market” reading.
Where the loss rate is low, the median gain is enormous: 125.5 per cent on Fisher Island, 118.2 in Coconut Grove. Where the loss rate is high, the median gain is small — 5.5 per cent in North Bay Village, 8.6 in the Design District. A genuinely weak market would show small gains and small losses. This shows the signature of time.
The three neighbourhoods at the top of the loss table are dominated by recently delivered buildings. A tower finished in the last few years can only produce resales with short holding periods, and a short hold gives a price almost no room to clear the cost of buying and selling, let alone grow. The neighbourhoods at the bottom are full of buildings that have stood for decades, so their round trips are ten and twenty years long.
Put plainly: these are not nine markets of differing quality so much as nine different lengths of ownership, and the roll is measuring the calendar as much as the market.
What this changes about how you buy
The useful question is not “what do these go for?” It is “what happened to the people who already owned one?” That is a question the public record can answer and a listing feed cannot.
In a new building, expect the early resale record to look poor and do not read it as a verdict. What you are seeing is people who bought at launch and sold within a few years, which is the hardest way to make money in any property market. The meaningful comparison is against other buildings of the same age, not against a 1980s tower on the same street.
In an older building, the long round trips are real but they are also long. A 125 per cent median gain accumulated over two decades is a different statement from a 125 per cent gain, and nothing in a tax roll annualises it for you.
And in both cases, ask how often anything trades at all. In a building where one home in thirty changes hands a year, last year’s sale down the hall is not a comparable; it is a historical curiosity from a different market.
Three things this table is not
It is not every building in each neighbourhood. It covers the buildings for which I hold a complete county pull, and the sample sizes differ a great deal. Coconut Grove rests on six buildings and 893 homes; the Upper Eastside on one building and 43 homes. A single building cannot stand for a neighbourhood, and I have shown the building count in the table rather than hiding it.
It is not adjusted for anything. No inflation, no carrying costs, no special assessments, no commissions. Since the Surfside collapse, assessments in older Florida condominiums have been substantial, and a resale recorded as a small nominal gain may well have been a real-terms loss once the owner paid to hold it.
And it is not a forecast. It is a record of what has already happened, which is the only thing a public roll can ever tell you. It is evidence about a building’s past owners, not a promise to its next one.
Verified 4 September 2026Miami-Dade County Property Appraiser, folio sales histories3 sources
Because both sides of the transaction are recorded. The Miami-Dade County Property Appraiser publishes a sales history for every folio, so where the same home has been bought and later sold you can compare the two recorded prices directly. This article counts only qualified sales, so nominal transfers such as quit claims and deeds in lieu of foreclosure are excluded. Of the nine covered here, Fisher Island: 193 recorded round trips, two of which sold below what the owner paid, and a median resale 125.5 per cent above the purchase price. Coral Gables is next at a 2.1 per cent loss rate. Both are dominated by long-established buildings with long holding periods. Not on its own. The neighbourhoods with the highest loss rates here are those with the newest buildings, where resales have had only a few years to move. Compare a new building against other new buildings, and judge an older one on its own long record. No. They are the recorded purchase and sale prices and nothing else. Inflation, carrying costs, special assessments, property taxes and commissions are all excluded, so a small recorded gain can still represent a real loss to the owner. Search the building address on the Miami-Dade County Property Appraiser website, open any folio, and read its sales history. Repeat it across several units and you have that building’s own resale record. It is free, it is public, and it is the same source used here.Miami condo resales — frequently asked questions
How do you know a Miami condo resale lost money?
Which Miami neighbourhood has the best condo resale record?
Does a high loss rate mean a neighbourhood is a bad investment?
Are these figures adjusted for inflation or costs?
Where can I check this for a specific building myself?
Sources
- Miami-Dade County Property Appraiser — folio sales histories for all 30 condominium buildings covered, pulled 4 September 2026. Qualified sales only.
- Miami-Dade County Property Appraiser — the public search used for every figure above.
- Josh Stein Realtor neighbourhood guides — the building lists each rollup is drawn from.
Josh Stein · Florida real estate sales associate, license SL3057661 · selling South Florida since 2002 · more than $1 billion closed.
Want the resale record for one specific building before you make an offer? Ask me and I will pull the folios and send you what the county actually has.
How has your building held its value? The Miami Condo Index ranks Miami condo buildings by their county sale records: real price per square foot, turnover and four-year change.