

Building facts
- Address
- 31 & 41 SE 5th Street
- Neighborhood
- Brickell
- Year built
- 2007
- Floors
- 46
- Residences
- 712
- Status
- Completed
- Developer
- Groupe Pacific International
- Architect
- Cohen Freedman Encinosa and Associates
- Pricing
- Starting at $475,000
Verified 22 August 2026Miami-Dade County Property Appraiser1 source
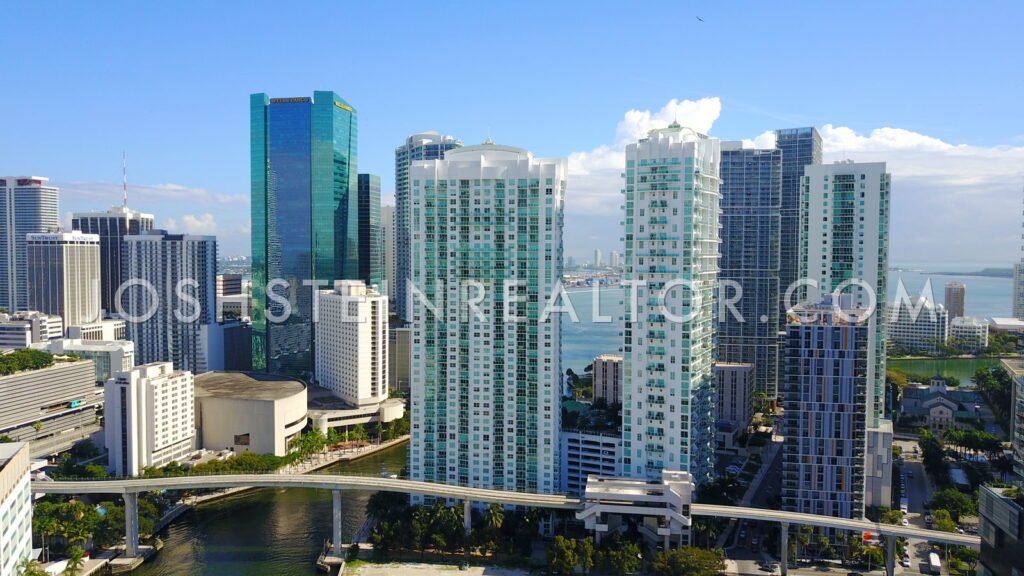
Aerial view of Brickell on the River
Key Takeaways
- This is two separate condominiums, not one building — the north tower at 31 SE 5th Street (384 homes) and the south tower at 41 SE 5th Street (327). They are filed separately and they have never traded alike.
- The two towers sold out three years apart, and it still shows — the north in 2006 at $347 per square foot; the south in 2008 and 2009 at $326 and then $182.
- The south tower’s owners have done more than twice as well — a median round trip of +38.6% against the north’s +15.1%.
- Both towers are falling now — the north is down 11.9% per square foot over four years and the south 6.7%, and 2026 is the weakest year in the record for both.
- Selling before 2021 was close to a coin toss that lost — 47.7% of south-tower exits and 45.4% of north-tower exits before 2021 were at a loss. After 2021: 13.0% and 9.4%.
- The south tower is the liquid one — about one home in eighteen trades each year, against one in twenty-nine in the north.
Brickell on the River, by the numbers
Developer: Groupe Pacific International · Architect: Cohen Freedman Encinosa and Associates · Starting at $475,000. Source: the building record on this site.
41 SE 5th Street, Miami, Florida 33131 |Neighborhood: Brickell
What is actually here — two condominiums, not one
Brickell on the River is described almost everywhere as a twin-tower development, which is true architecturally and misleading in every way that matters to a buyer. The county holds it as two entirely separate condominiums, with two separate declarations, two separate sets of common elements and two separate price histories.
| North tower | South tower | |
|---|---|---|
| County address | 31 SE 5th Street | 41 SE 5th Street |
| Folios / homes | 405 / 384 | 334 / 327 |
| Shares close at | 100.0008% | 100.0880% |
| Size range | 757–1,513 sq ft | 952–1,510 sq ft |
| Median size | 1,051 sq ft | 1,267 sq ft |
| 2026 assessed median | $381,629 | $389,282 |
Seven hundred and eleven homes in total. The 21 non-residential folios in the north tower are almost all ground-floor commercial — 20 store condominiums plus one further commercial parcel — and the south tower carries three store condominiums and four folios the county classes as residential but which sit outside the home count. Both declarations close at essentially exactly 100%, so both pulls are whole.
The two buildings are also composed differently. The north tower is the smaller-unit building: 153 one-bedrooms, 186 two-bedrooms, 40 three-bedrooms and five studios, with a median home of 1,051 square feet. The south tower has no studios and no three-bedrooms at all — 160 one-bedrooms and 167 two-bedrooms, nothing else, with a median home of 1,267 square feet. If you want a three-bedroom here, there are exactly 40 of them and they are all in the north tower.
Six floorplates cover 295 of the north tower’s 384 homes and 239 of the south tower’s 327. Both buildings are highly repetitive.
The price record, tower by tower
Qualified, arm’s-length sales from the county record, retrieved 22 August 2026. North tower — 31 SE 5th Street:
| Year | Qualified sales | Median price | Median $/sq ft |
|---|---|---|---|
| 2023 | 19 | $613,000 | $564 |
| 2024 | 13 | $565,000 | $538 |
| 2025 | 14 | $422,500 | $503 |
| 2026 to date | 7 | $416,300 | $497 |
South tower — 41 SE 5th Street:
| Year | Qualified sales | Median price | Median $/sq ft |
|---|---|---|---|
| 2023 | 37 | $585,000 | $471 |
| 2024 | 15 | $600,000 | $552 |
| 2025 | 11 | $599,000 | $473 |
| 2026 to date | 9 | $465,000 | $440 |
Both towers are down over four years and both are at their weakest in 2026 — the north by 11.9% per square foot, the south by 6.7%. On 53 and 72 sales respectively, that is enough transactions to treat the direction as real. The magnitude is another matter: the north tower’s median price column falls from $613,000 to $416,300, which reads as a 32% collapse, while the per-foot column falls 12%. The difference is floorplate mix — smaller homes sold in 2025 and 2026 — and the per-foot number is the honest one.
The four-year bands are $336 to $600 per square foot in the north (median $535) and $387 to $616 in the south (median $472). The north tower carries the higher per-foot price and the smaller homes; the south carries larger homes at a lower rate. The highest recorded prices are $840,000 in the north (unit 4021, 1,513 square feet, 13 November 2023, $555 per square foot) and $810,000 in the south (unit 2008, 1,402 square feet, 9 August 2023, $578 per square foot).
The south tower is meaningfully more liquid. Seventy-two sales in four years across 327 homes is about one home in eighteen each year; the north’s 53 across 384 homes is one in twenty-nine. If being able to sell matters to you, that gap is the practical difference between the two buildings.
Why the north tower and the south tower are different investments
The two towers sold out three years apart, and the record still carries that difference two decades later.
The north tower sold out in 2006: 375 of its 384 homes recorded their first qualified sale that year, at a median of $347,953 and $347 per square foot. That was the top of the market.
The south tower sold out into the crash. Seventeen homes went in 2007 at a median of $404,191 and $343 per square foot — roughly the same level as the north. Then 157 homes went in 2008 at $351,688 and $326 per square foot, and 153 more in 2009 at $220,000 and $182 per square foot. Buyers in the south tower’s largest cohort entered at roughly half the price the north tower’s buyers had paid three years earlier.
The consequence, on the record:
| North tower | South tower | |
|---|---|---|
| Completed round trips | 302 of 384 | 245 of 327 |
| Sold at a loss | 91 — 30.1% | 69 — 28.2% |
| Median outcome | +15.1% | +38.6% |
| Median hold | 12.9 years | 12.5 years |
| Best result | +151.5% | +273.3% |
| Worst result | −80.2% | −50.7% |
Same address, same era, same architecture — and the south tower’s owners have done more than twice as well. The best result in the south is a 952 square foot home bought for $150,000 in July 2009 and sold for $560,000 in June 2024, up 273.3%. The worst result in the north is a 1,419 square foot home bought for $540,000 in February 2006 and sold for $107,000 in October 2014 — down 80.2%, and the deepest single loss I have recorded at this address.
In both towers, the exit year mattered more than the tower. Of the south tower’s 107 owners who sold before 2021, 51 lost money — 47.7%, at a median of +2.1%. Of the 138 who sold in 2021 or later, 18 lost, at a median of +62.8%. The north tells the same story more starkly: 45.4% of pre-2021 exits lost, against 9.4% after, with the median rising from +3.0% to +36.1%.
Read those two facts together and the conclusion is uncomfortable but plain. Fifteen years of holding produced a median of +15.1% in the north tower — before commissions, taxes, assessments and carrying costs, which over fifteen years are not small. My honest reading is that the north tower has been a place to live rather than a place to make money, and that the south tower’s better numbers are a function of its entry price in 2009, not of anything about the building.
The county record shows transactions and not reasons, so none of this establishes why either tower behaved as it did.
Who this building suits, and who it suits badly
It suits a buyer who wants river frontage in Brickell at a genuinely low per-foot price. A median 2026 assessed value under $390,000 in both towers, at $440 to $560 per square foot, is among the least expensive entry to this part of Brickell that the county record contains.
If you want a three-bedroom, only the north tower has them — 40 homes out of 711. If you want the larger median home and the better liquidity, that is the south tower. Those two preferences point at different buildings, and a listing that says only “Brickell on the River” will not tell you which one you are looking at. Check the street number: 31 is north, 41 is south.
It suits a buyer expecting appreciation badly. Both towers are down over four years, both are at their weakest point in 2026, and the north tower’s twenty-year median round trip is +15.1%. Nothing in this record supports buying here for growth.
And if you are selling here: know which tower’s comparables you are being shown. The north trades at a higher rate per square foot on smaller homes and the south at a lower rate on larger ones, so a per-foot comparison across the two flatters one and punishes the other depending on which way it runs. The 2026 sales in both towers are the weakest in four years, and a buyer’s agent will lead with them.
Brickell on the River — Frequently Asked Questions
Is Brickell on the River one building or two?
Two — and the county holds them as two entirely separate condominiums with separate declarations. The north tower is at 31 SE 5th Street with 384 homes; the south tower is at 41 SE 5th Street with 327. They have separate common elements and separate price histories, and they have never traded alike. When you look at a listing here, check the street number.
How many condos are there in total?
Seven hundred and eleven. The county holds 405 folios at 31 SE 5th Street (384 homes, 21 commercial) and 334 at 41 SE 5th Street (327 homes, seven other). Both declarations close at essentially exactly 100%, which confirms nothing is missing from either count.
Which tower is better?
On the ownership record, the south. Its 245 completed round trips show a median of +38.6% against the north tower’s +15.1% across 302 round trips. But that gap is mostly entry price, not quality: the north sold out in 2006 at $347 per square foot and the south sold out in 2008 and 2009 at $326 and then $182. The south tower is also the more liquid of the two.
What do homes sell for at Brickell on the River?
Across 2023 to 2026, the north tower’s qualified sales fall in a band of $336 to $600 per square foot (median $535) and the south tower’s in a band of $387 to $616 (median $472). The highest recorded prices are $840,000 in the north and $810,000 in the south, both in 2023.
Are prices here going up or down?
Down. The north tower is off 11.9% per square foot over four years and the south 6.7%, and 2026 is the weakest year in the record for both. That is on 53 and 72 sales respectively, which is enough to treat the direction as real. Be careful with the median price column in the north, which falls 32% — most of that is smaller homes selling, not a repricing.
Have owners here made money?
It depends heavily on when they sold. In the south tower, 47.7% of the 107 owners who exited before 2021 lost money, against 13.0% of the 138 who sold afterwards. In the north, 45.4% before 2021 against 9.4% after. Across all completed round trips the medians are +38.6% in the south and +15.1% in the north, over median holds of about thirteen years — gross, before commissions, taxes, assessments and carrying costs.
Where are the three-bedroom homes?
All 40 of them are in the north tower at 31 SE 5th Street. The south tower has no three-bedrooms and no studios at all — it is 160 one-bedrooms and 167 two-bedrooms, and nothing else.
How often do homes sell here?
The south tower recorded 72 qualified sales across four years in 327 homes, about one home in eighteen each year. The north recorded 53 across 384 homes, about one in twenty-nine. The south tower is the one where you can reasonably expect to be able to sell.
Sources and further reading
Interested in selling at Brickell on the River?
Learn more about selling your condo at Brickell on the River with Josh Stein.
Thinking about Brickell on the River?
I have sold South Florida property since 2002, more than $1 billion of it. Ask me for the recorded declaration, what has genuinely closed, or a straight answer on whether this building fits what you are after.
Josh Stein · Florida real estate sales associate, license SL3057661 · (305) 695-8257 · hello@joshsteinrealtor.comRelated coverage
Part of Miami Luxury Condos.