

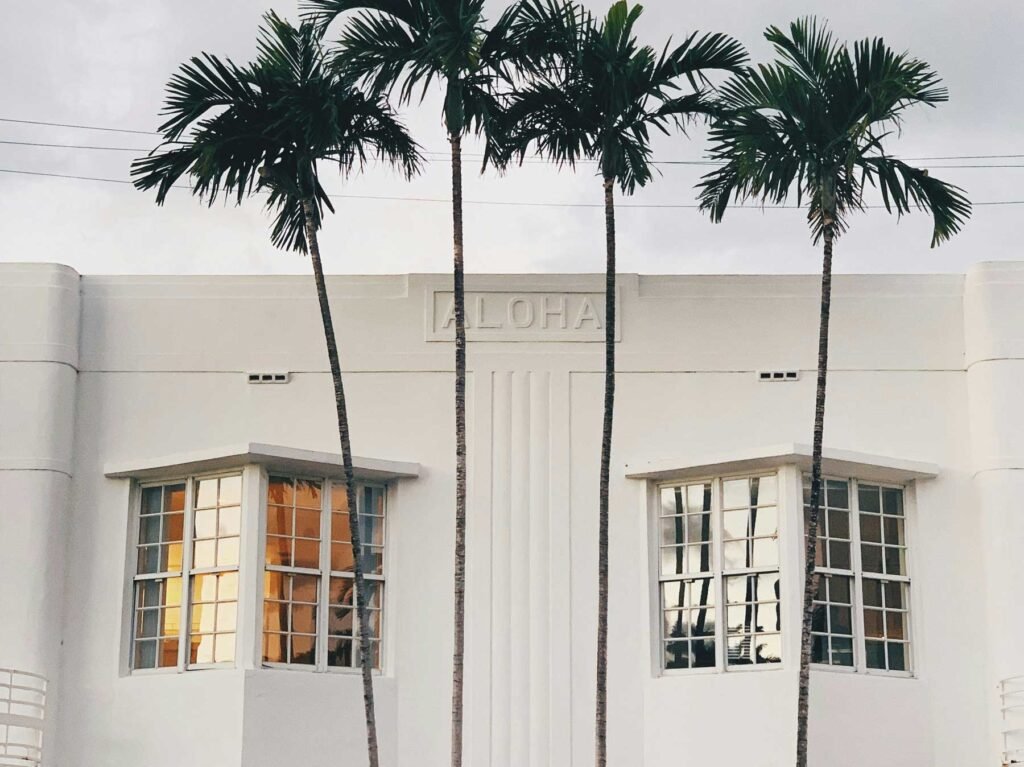
Miami Lofts · Miami Beach · Vilasol Lofts
20 homes make up Vilasol.
By Josh Stein · Florida license SL3057661 · Updated 12 October 2026Leer en español →
Nearby Vilasol Lofts
39 listingsNearby Vilasol Lofts No units are for sale in Vilasol Lofts right now. These are condos for sale within 0.6 km, closest first.


Listing information is deemed reliable but is not guaranteed and is provided exclusively for consumers' personal, non-commercial use. Data is supplied by the MLS and may be subject to change or withdrawal without notice.
Last updated 1 second ago
Verified 23 September 2026Miami-Dade County Property Appraiser1 source
Key Takeaways
- Vilasol Lofts recorded only one sale in the 12 months to 23 September 2026 — on the Miami-Dade County Property Appraiser record, too few for a reliable median. The latest recorded sale was on 3 October 2025. Own at Vilasol Lofts? Ask Josh what yours would sell for on WhatsApp.
- 20 homes make up Vilasol, — at 7744 Collins Avenue in Miami Beach’s North Shore — the declaration closes at exactly 100% on the county’s common-element share test, and all 20 folios are residential homes.
- No qualified sales closed here in 2023 or in 2026 to date; — all 5 of the current window’s sales fall in 2024 and 2025 — too few, and too concentrated in two years, to call a confirmed trend.
- The highest sale of the last four years is $612,000, on 12/11/2024, for a 1,080 sq ft home at unit 9, $567 per square foot, 7.3% below the all-time high of $660,000 set in June 2006.
- 16 of the building’s 20 homes (80.0%) have a documented round trip, and 15 of the 16 gained: a median gain of 30.4% over a median 15.0-year hold, first qualified sale to latest. Counted on every individual resale instead, 8 of 29 sold below the prior price (27.6%).
- One home carries a 2026 assessed value of just $32,566, — against a building median of $466,900 — I can’t explain the gap from the county record, so I’m flagging it rather than folding it into any range.
7744 Collins Avenue, Miami Beach, Florida 33141 | Neighborhood: Miami Beach
Twenty Homes on Collins Avenue in North Shore
I pulled all 20 folios the Miami-Dade County Property Appraiser has on file for Vilasol at 7744 Collins Avenue, Miami Beach, FL 33141 — the county’s own neighborhood field for this address reads North Shore. The declaration closes at exactly 100.0000% on the county’s common-element share test, and all 20 folios are residential homes; there are no commercial, parking or storage folios to exclude.
The bed mix runs 4 homes (20.0%) at 1 bedroom and 16 (80.0%) at 2. Heated area runs from 772 to 1,380 square feet, median 1,103, with the building’s most common floorplate, 1,103 sq ft, alone accounting for 8 of the 20 homes, 40.0%.
On the 2026 tax roll, 19 of the 20 homes carry assessed values from $151,364 to $565,335, median $466,900. The 20th, unit 16, carries a 2026 assessed value of just $32,566 — I can’t explain that gap from the property record itself, and I’d rather flag it plainly than fold it into a range that would misrepresent the rest of the building.
The county’s year-built field reads 2005 for all 20 folios. I don’t have a confirmed story count, architect or amenity list for this building: none of that is in the property record, and I’d rather say so than fill it in from a listing site.
Five Sales, Concentrated in Two Years
| Year | Qualified sales | Median price | Median $/sq ft |
|---|---|---|---|
| 2023 | 0 | — | — |
| 2024 | 2 | $528,500 | $557 |
| 2025 | 3 | $590,000 | $535 |
| 2026 to date | 0 | — | — |
There were no qualified sales at Vilasol in 2023 or so far in 2026. All 5 of the window’s sales fall in 2024 and 2025, at $528,500 to $612,000, $528 to $567 a foot. That’s too little, and too concentrated, to call a confirmed direction — the two years available look fairly consistent with each other, which is a mild positive sign, but I wouldn’t build a trend line out of it. Against 20 homes, five sales in four years works out to a turnover of one home in 16 each year.
The highest sale inside this window is $612,000, closed 12/11/2024, for a 1,080 sq ft home at unit 9, $567 per square foot. That is 7.3% below the building’s all-time high, $660,000, set in June 2006 for a 1,380 sq ft home.
A Building Where 15 of 16 Round Trips Gained
Looking at homes bought and later resold, both legs a qualified transaction: 16 of the building’s 20 homes (80.0%) have one, counting each home once, from its first qualified sale to its latest. 15 sold for more than the previous owner paid; just 1 sold for less. The median change across all 16 is a gain of 30.4%, over a median 15.0-year hold; among the 15 gainers alone the median gain is 33.3%. The range runs from -13.3% to +85.4%. Counting every individual resale instead (a home that sold three times counts twice), 8 of 29 sold below the prior owner’s price, 27.6%: 6 of 18 for chains that began in the 2000s and 2 of 10 for those that began in the 2010s, and the one chain that began in the 2020s gained. Three chains broken by a foreclosure are set aside.
The building’s largest gain: an 814 sq ft home bought for $240,000 in February 2006 and sold for $445,000 in April 2024, +85.4% over 18.2 years. The single per-home loss is modest by comparison: a 1,103 sq ft home bought for $450,000 in January 2006 and sold for $390,000 in September 2019, -13.3%. Five qualified sales here, from 2005 through 2010, closed at $225 to $289 a square foot — well below the building’s current band — but even including that stretch, the per-home round-trip record is one-sided in favor of gains.
Who Vilasol Suits, and Who It Doesn’t
Vilasol suits a buyer who wants a small, two-bedroom-dominant building in Miami Beach’s North Shore with a mostly positive resale record: 15 of 16 homes gained between their first and latest sale (8 of 29 individual resales sold below the prior price), and the two most recent years of sales are fairly consistent with each other. It also suits a buyer comfortable with limited current data, since the 2024-2025 window is the only recent evidence available.
It suits buyers badly who need a wide set of current comparables — there were no qualified sales in 2023 or so far in 2026, and the entire window rests on just 5 transactions. A buyer’s agent may also flag the one outlier assessed value on the roll, which the record doesn’t explain.
If you are selling: your best comparables are the five 2024-2025 sales, $528,500 to $612,000, and the building’s own 2006 peak of $660,000. With volume this thin, expect a longer marketing period and be ready to point to the building’s round-trip record, 15 of 16 homes gained, as part of your case.
Vilasol — Frequently Asked Questions
How many homes are in Vilasol?
The Miami-Dade County Property Appraiser lists 20 folios for Vilasol at 7744 Collins Avenue, Miami Beach, FL 33141 (North Shore), and all 20 are residential homes. The declaration closes at exactly 100.0000% on the county’s common-element share test.
How many homes have sold recently at Vilasol?
Five in the last four years — two in 2024, three in 2025 — with none at all in 2023 or so far in 2026. That is too few, and too concentrated in two years, to call a confirmed direction.
What is the highest price a home has sold for at Vilasol?
The highest price on record is $660,000, in June 2006, for a 1,380 sq ft home. The highest in the last four years is $612,000, closed 12/11/2024, for a 1,080 sq ft home at unit 9, $567 per square foot, 7.3% below that 2006 high.
Do owners at Vilasol typically make or lose money?
Of the building’s 20 homes, 16 (80.0%) have a documented round trip, and the record is mostly positive: 15 gained, only 1 lost. The median change across all 16 is +30.4% over a median 15.0-year hold, first qualified sale to latest. Counted on every individual resale, 8 of 29 sold below the prior price (27.6%).
What is the unusual assessed value at Vilasol about?
One home, unit 16, carries a 2026 assessed value of just $32,566 against a building median of $466,900. The county record does not explain the gap, so it is reported plainly rather than folded into any range.
How often do homes turn over at Vilasol?
With five qualified sales across the last four years against 20 homes, turnover works out to one home in 16 each year.
What is not known about Vilasol from the county record?
The county’s year-built field reads 2005. Story count, architect and amenity details are not part of the Property Appraiser’s record, so none of those facts appear on this page. Only what the county record itself supports is published here.
Own at Vilasol Lofts?
If you own here, this page already carries the county’s record of what homes in Vilasol Lofts have sold for. Here is how to use it.
Your three options
- Sell. Price against what comparable homes in the building have actually recorded, not against asking prices.
- Rent it out. Within the condominium’s rental rules, which vary from building to building.
- Hold. Watch the record: this page is updated from the county as new sales are posted.
What I will send you
Tell me your unit. I will send you the recorded sales of comparable homes in Vilasol Lofts, what they sold for per square foot, and a straight read on what yours could sell for today.
Two free things for owners
Sources and further reading
Interested in selling at Vilasol Lofts Miami Beach?
Learn more about selling your condo at Vilasol Lofts with Josh Stein.
Thinking about Vilasol Lofts?
I have sold South Florida property since 2002, more than $1 billion of it. Ask me for the recorded declaration, what has genuinely closed, or a straight answer on whether this building fits what you are after.
Josh Stein · Florida real estate sales associate, license SL3057661 · (305) 695-8257 · hello@joshsteinrealtor.comGet this building’s next recorded sale — before the listing sites catch up
- Every closed sale we can verify from the Miami-Dade record — price, date, and $/sqft when the deed supports it — not an IDX feed.
- Optional alert when a new deed posts in this building (or a short list of comps you choose).
- No spam inventory blasts. One building. One record. You decide what happens next.
Tell Josh which building. He’ll send the latest closed sales and set a quiet alert.
Get the sales recordFrequently asked questions
Are there real converted-warehouse lofts in Miami?
Very few. Parc Lofts at 1749 NE Miami Court is described in the trade as one of the few true industrial-loft buildings in Miami, with 15-foot ceilings on floors one to four and 20-foot ceilings on floors five and six. Most Miami buildings marketed as lofts, including Neo Lofts, Filling Station Lofts, Wynwood Lofts and Loft Downtown I and II, are purpose-built new construction in a loft aesthetic dating from 2002 to 2016.
How much does a loft cost in Miami?
Downtown loft-style condominiums start around $282,000 to $307,000 and average $414 to $451 per square foot across Neo Lofts, Loft Downtown I and Loft Downtown II, on 2026 data. Large-format industrial lofts sit far higher: Parc Lofts runs roughly $1.3 million to $3.0 million at about $756 per square foot for units of 1,970 to 3,774 square feet.
Are Miami lofts good value compared with condos?
On a per-square-foot basis, clearly. Downtown loft product trades at roughly $414 to $451 per square foot while the Downtown luxury condo segment ran $730 per square foot in Q1 2026. Carrying costs are lower too: Loft Downtown II has an HOA near $0.93 per square foot per month against $4 to $7 in South Beach trophy towers.
Which Miami neighborhoods have lofts?
The concentrations are Downtown Miami with Loft Downtown I and II, the Arts and Entertainment District with Parc Lofts and Filling Station Lofts, Wynwood with Wynwood Lofts, Edgewater with Star, Bay and Uptown Lofts, and the Miami River and Brickell edge with Neo Lofts. South Beach has a small cluster of boutique loft buildings including Ilona Lofts and Montclair Lofts, and Coconut Grove has Lofts at Mayfair.
What are the largest lofts in Miami?
Parc Lofts has the largest floorplates of any loft building in the city, with units from 1,970 to 3,774 square feet. Filling Station Lofts runs 832 to 1,639 square feet with 18-foot ceilings. Most Downtown loft towers top out near 1,150 to 1,185 square feet.
Why does nobody build new lofts in Miami anymore?
Land economics. Edgewater and Brickell luxury condos traded at $978 and $950 per square foot in Q1 2026 while loft product trades near $420. A four to six-storey building with 35 to 70 units cannot compete for the same land as a 40-storey tower, and 20-foot ceilings consume roughly two conventional floors of height under fixed limits. No meaningful loft supply has been added since about 2016.
How long do Miami lofts take to sell?
Loft Downtown II averaged 129 days on market over the six months ending July 2026, with sold prices averaging $422 per square foot against an asking average of $451. Downtown carried 46 months of luxury inventory in Q1 2026, the highest in Greater Downtown, which gives buyers meaningful negotiating room.
Who buys lofts in Miami?
Three groups. Creative professionals, since Parc Lofts is documented as a favourite among photographers, musicians and artists and Wynwood Lofts is marketed as a live/work building. Entry-point urban buyers, because Downtown lofts start below $310,000 against a $425,000 Miami-Dade condo median. And rental investors attracted by the low HOA structure, with Loft Downtown II listing 17 units for rent against 15 for sale in July 2026.
Related coverage
Part of Miami Lofts.